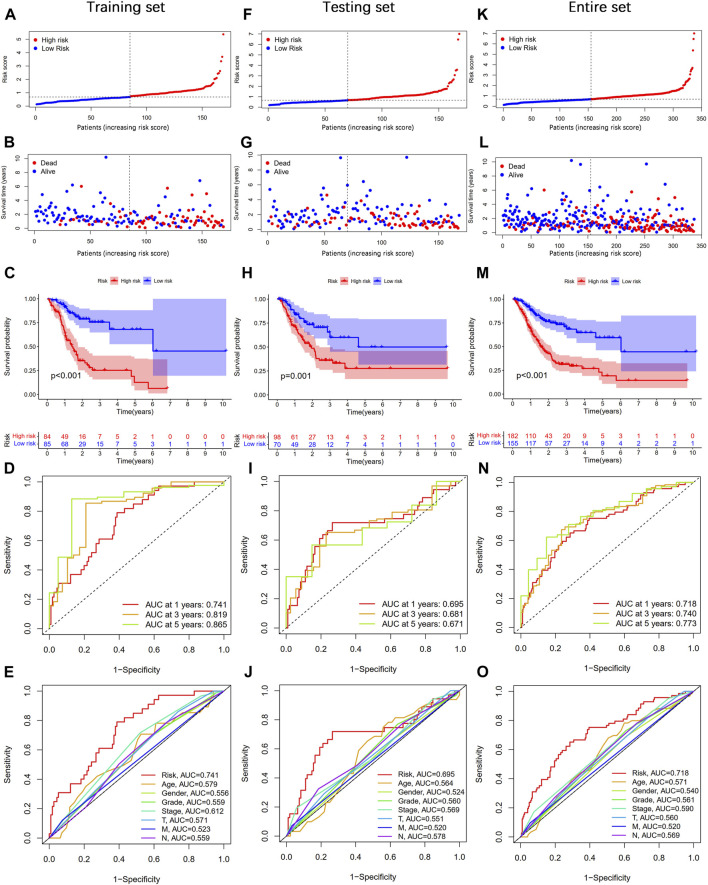
FIGURE 4.
Prognosis value of the cellular senescence-related lncRNA prognostic signature (CSLPS). (A) Distribution of risk score, (B) survival status, (C) Kaplan–Meier survival curves, (D) the 1-, 2-, and 3-year ROC curves, (E) and the 1-year ROC curves of risk score and clinical characteristics in the training set. (F–O) Validation sets, including the testing set and the entire set, were analyzed similarly.

