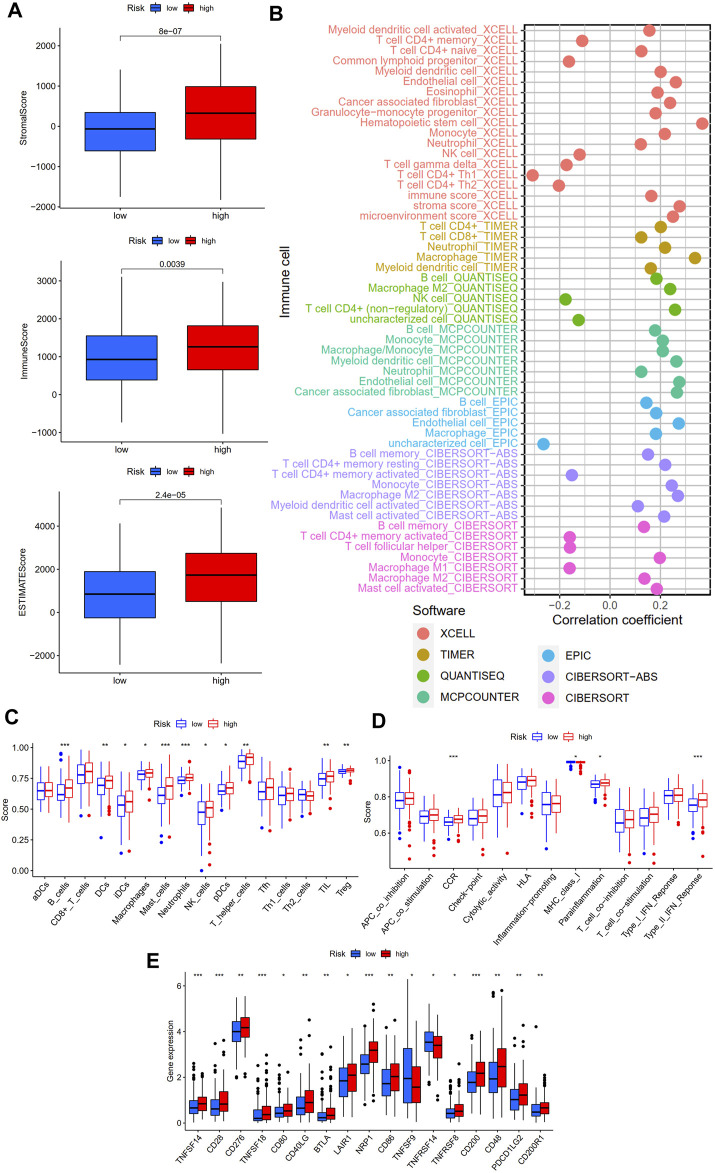
FIGURE 9.
Immune landscape of the cellular senescence-related lncRNAs model. (A) Tumor microenvironment analysis between high- and low-risk groups by ESTIMATE. (B) Correlation analysis of immune components and risk scores based on XCELL, TIMER, QUANTISEQ, MCPCOUNTER, EPIC, CIBERSORT-ABS, and CIBERSORT algorithms. (C) Sixteen immune cells and (D) 13 immune-related functions between the high- and low-risk groups by ssGSEA. (E) Expression of immune checkpoint-related genes between the high- and low-risk groups. *p < 0.05; **, p < 0.01; ***p < 0.001.

