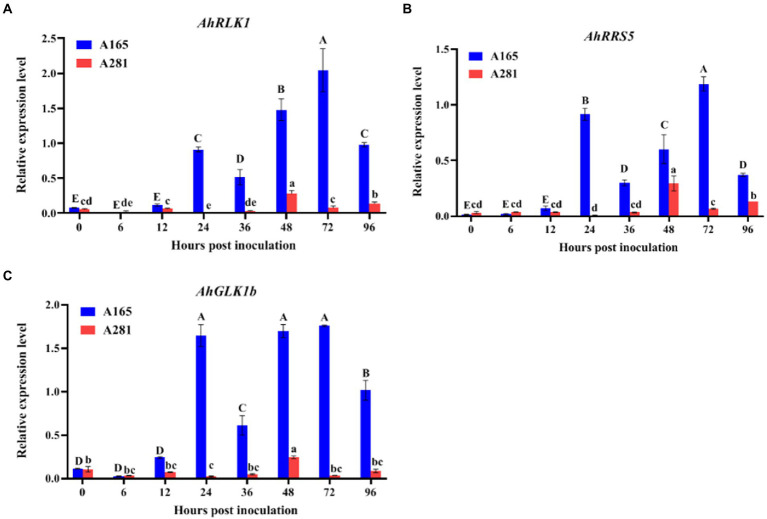
Figure 2.
Expression analysis of AhRLK1, AhRRS5 and AhGLKb in the leaves of A165 and A281 at 0, 6, 12, 24, 36, 48, 72, and 96 hpi with R. solanacearum HA4-1. Error bars represent standard errors. Different uppercases and lowercases indicate significant differences in the leaves of A165 and A281 at different timepoints according to ANOVA (p < 0.05), respectively.

