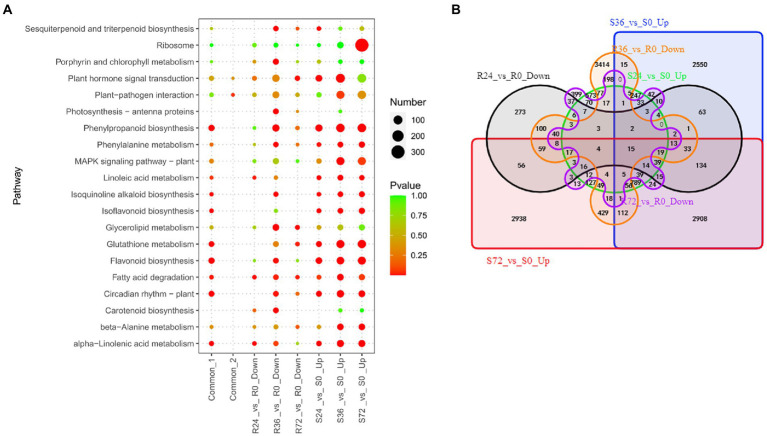
Figure 4.
Identification of susceptibility-response DEGs in R24 vs. R0, R36 vs. R0, R72 vs. R0, S24 vs. S0, S36 vs. S0, and S72 vs. S0. (A) KEGG enrichment analysis of common, up-regulated, and down-regulated DEGs in each treatment comparison. Common-1 indicates the common up-regulated DEGs in S24 vs. S0, S36 vs. S0, and S72 vs. S0. Common-2 is the common down-regulated DEGs in R24 vs. R0, R36 vs. R0, and R72 vs. R0. (B) A big Venn diagram of DEGs for up-regulated DEGs in Ss vs. S0 and down-regulated DEGs in Rs vs. R0.

