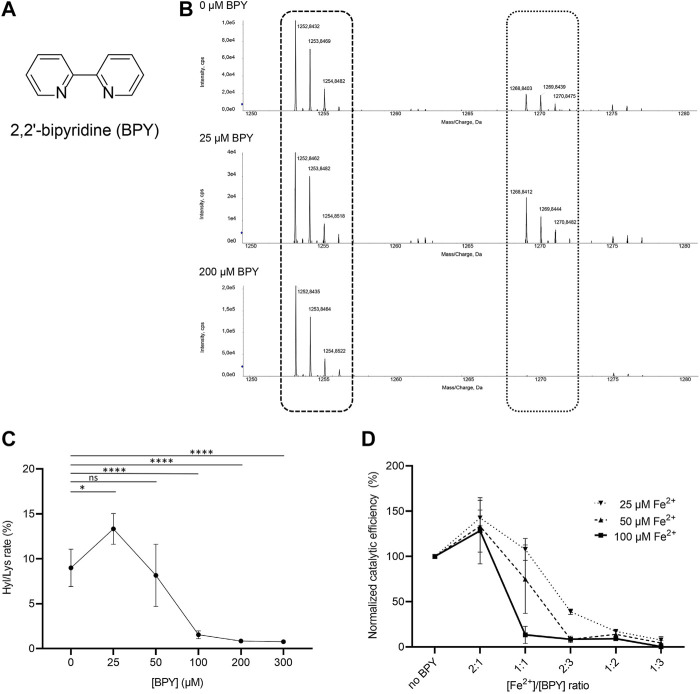
FIGURE 6.
Evaluation of the effect of 2,2’-bipyridil (BPY) on LH3/PLOD3 enzymatic activity. (A) Chemical structure of BPY. (B) Detection of Hyl formation using direct mass spectrometry (MS) assays, and evaluation of the effect of BPY on Lys-to-Hyl conversion. The scheme shows the comparison between three MS spectra, showing the peaks consistently detected for unmodified Lys in the synthetic peptides (dashed box) and the presence of additional peaks (dotted box) indicating Hyl formation. (C) Results of MS analysis of LH3/PLOD3 enzymatic activity as a function of BPY concentration. The plot shows the presence of an unexpected increase of enzymatic activity at low BPY concentrations, followed by a drop consistent with inhibition due to sequestration of catalytic Fe2+. Error bars represent standard deviations from average of triplicate independent experiments. Statistical evaluations based on pair sample comparisons between data points collected in absence or in presence of [Fe2+] using Student’s t-test. ns, non-significant; *, p-value<0.05; **, p-value<0.01; ***, p-value<0.001; ****, p-value < 0.0001. (D) Evaluation of LH3/PLOD3 enzymatic activity as a function of varying [BPY]/[Fe2+] ratios. The analysis shows that the enzymatic activity increase, already observed at low BPY concentration, depends on the residual Fe2+ concentration available for catalysis. Error bars represent standard deviations from average of triplicate independent experiments. Statistical analyses conducted by comparing data points collected at the same [Fe2+]/[BPY] ratio using one-way ANOVA analysis highlight non-significant differences for experiments performed using different concentrations of Fe2+ in the assay. Additional statistical evaluations for each data point are provided in Supplementary Figure S3.

