FIGURE 7.

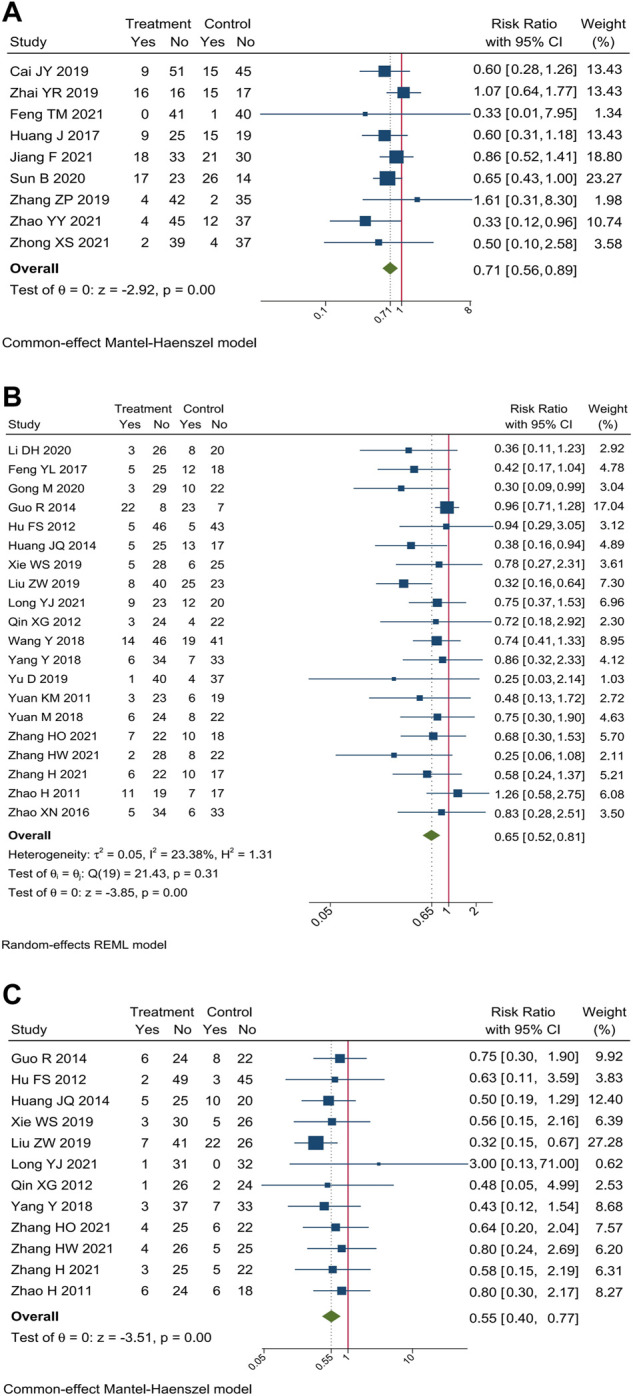
Forest plot of incidence of hepatorenal toxicity. Incidence of (A) hepatorenal toxicity, (B) hepatotoxicity, and (C) renal toxicity.

Forest plot of incidence of hepatorenal toxicity. Incidence of (A) hepatorenal toxicity, (B) hepatotoxicity, and (C) renal toxicity.