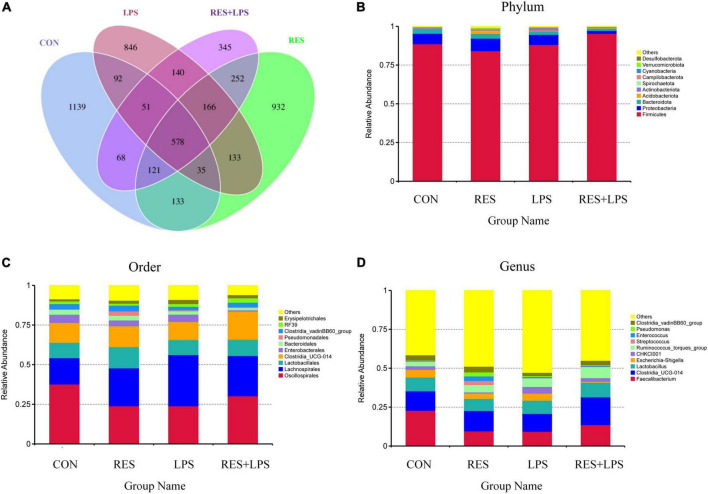
FIGURE 3.
The Venn diagram and relative abundances of bacteria at the phylum, order, and genus levels. (A) Venn diagram. (B) Top 10 bacteria at phylum level. (C) Top 10 bacteria at order level. (D) Top 10 bacteria at genus order. CON, control; RES, resveratrol; LPS, lipopolysaccharide; RES + LPS, dietary resveratrol treatment followed by LPS challenge.

