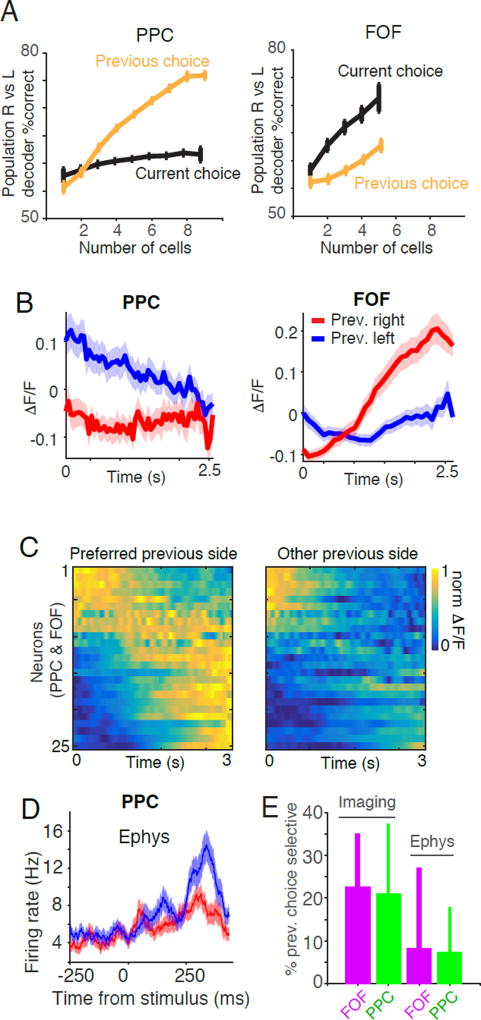
Figure 8. Previous choice tuning in FOF and PPC.
(A) Performance of a linear classifier in decoding task events based on the activity of simultaneously recorded neurons in FOF and PPC. The choice of the animal on the previous trial was decoded based on the average activity during the entire trial. Left panel: In PPC, the classifier is significantly better at decoding the previous choice of the animal (orange line) than the upcoming choice (black line). Right panel: In FOF the classifier performs significantly better at decoding the upcoming choice (black line) than the previous choice of the animal (orange line). (B) Example GCaMP6f responses of two neurons recorded in PPC (left panel) and FOF (right panel) that exhibited different dynamics depending on the previous choice of the animal. Red line indicates the ΔF/F on trials in which the animal chose right on the previous trial, blue line indicates the average ΔF/F on trials in which the animal chose left on the previous trial. Shaded region represents s.e.m. (C) Dynamics of all previous choice selective neurons (n=25) separated by the previous choice of the subject and sorted by the time of the center of mass of activity on the preferred side. Each row represents an individual neuron. Color indicates the normalized ΔF/F. (D) Similar effects are seen in PPC electrophysiological recordings during auditory evidence accumulation. Responses of an example neuron recorded in PPC during the auditory accumulation of evidence task. Red line indicates the average firing rate on trials in which the animal chose right on the previous trial, blue line indicates the average firing rate on trials in which the animal chose left on the previous trial. Shaded region represents s.e.m. (E) Comparison of the percentage of previous choice selective neurons recorded using calcium imaging vs using tetrode recordings. Error bars indicate the 95% binomial confidence interval.

