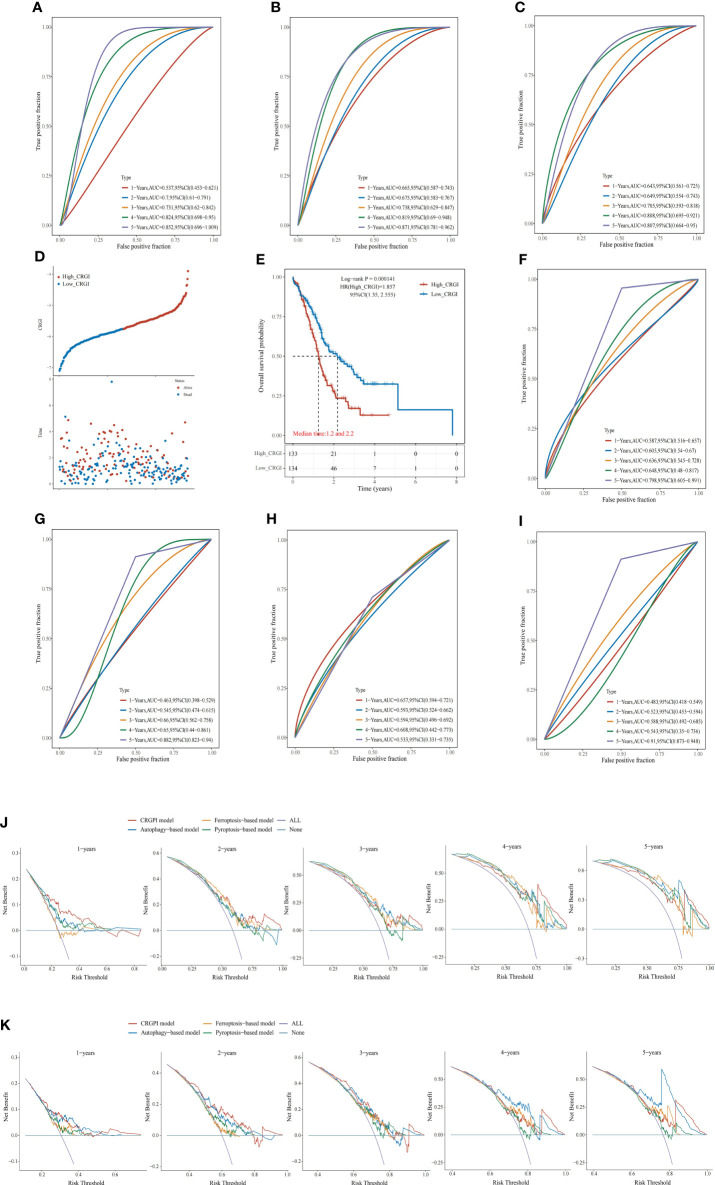
Figure 3.
Comparison of other cell death mechanisms-based prognostic signatures in PAAD. (A–C) The ROC curve of autophagy-, ferroptosis-, and pyroptosis-based models in the TCGA dataset, respectively. Distribution of the CRGI and survival status of individual PAAD patients (D), and Survival analysis (E) of the high- and low-CRGI groups in the ICGC dataset. (F–I) The ROC curve of our model, the autophagy-, ferroptosis-, and pyroptosis-based models in the ICGC dataset, respectively. DCA diagrams of our model, the autophagy-, ferroptosis-, and pyroptosis-based models in the TCGA dataset (J), and ICGC dataset (K). All: all positive; None: all negative. They are the extreme conditions that serve as background references.

