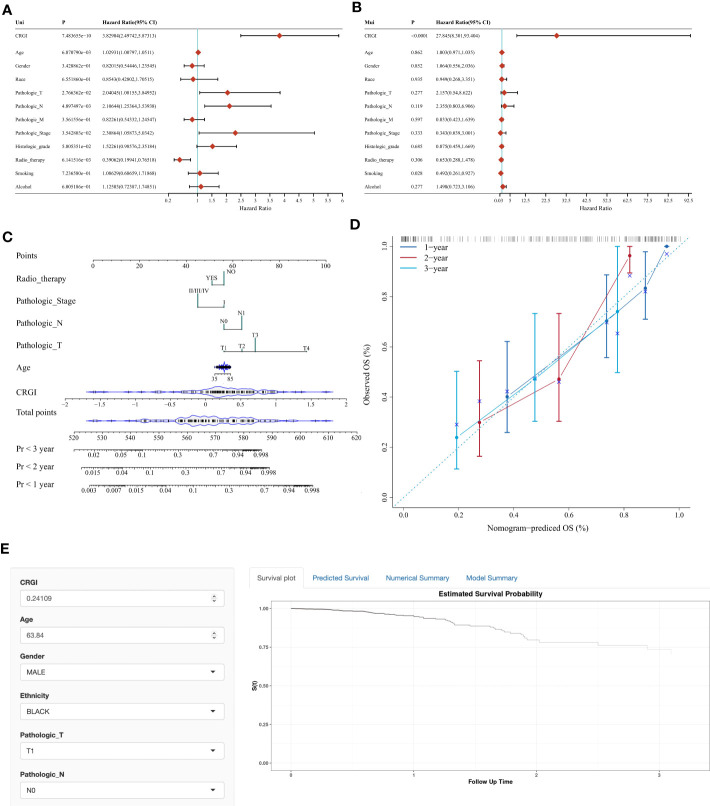
Figure 4.
Nomogram with clinicopathological characteristics to predict OS in PAAD. (A, B) Forest plots of the results of the univariate and multivariate Cox regression, respectively. (C, D) Conventional nomogram and its calibration curve based on our model. (E) The screenshot of the web-based OS calculator calculating a fictional case.

