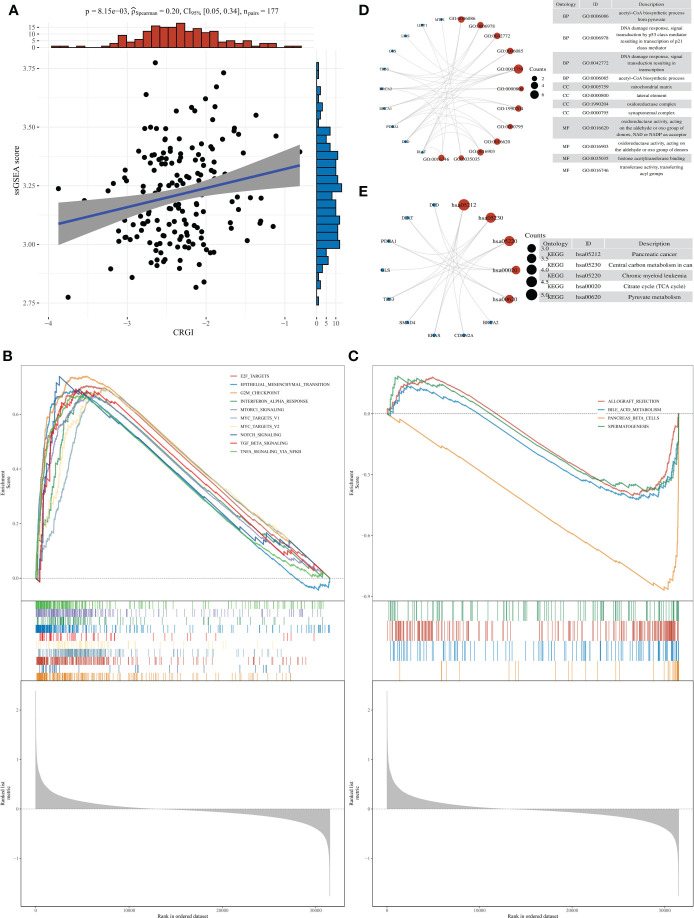
Figure 5.
Over-representation analysis of CRGI in PAAD. (A) Correlation analysis of the CRGI and ssGSEA score. (B) The top 10 most enriched and upregulated cancer hallmarks in the high-CRGI group. (C) The 4 downregulated cancer hallmarks in the low-CRGI group. (D) The enriched GO terms of CRGI genes. (E) The enriched KEGG pathways of CRGI genes.

