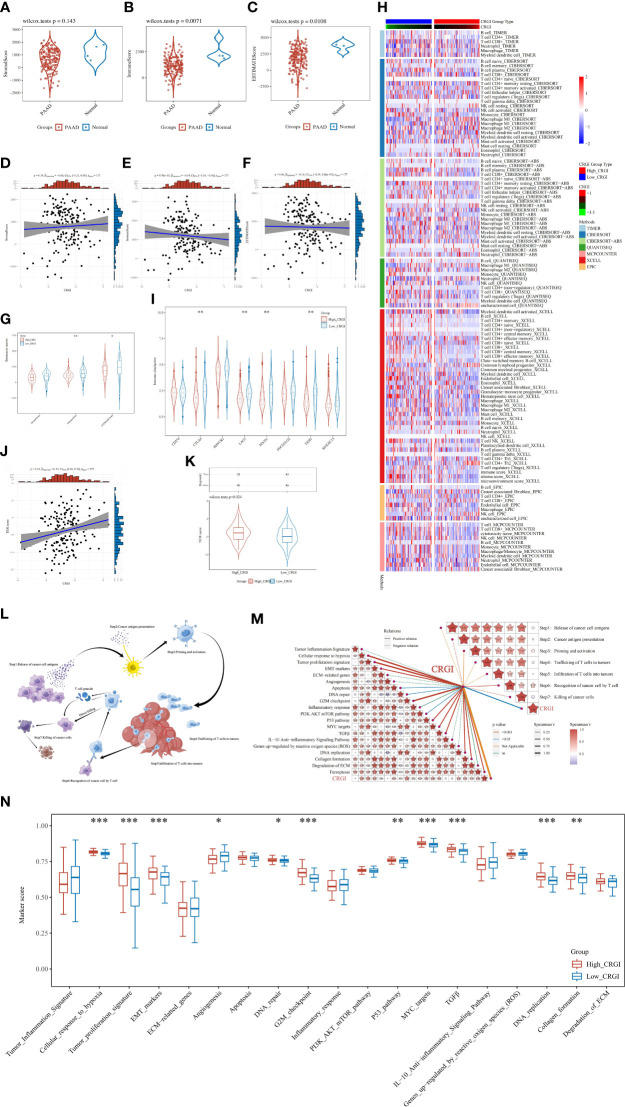
Figure 6.
In-depth analytics on the relationship between CRGI and the tumor microenvironment condition, immune cell infiltration, immunotherapy efficacy, TMB, as well as the cancer-immunity cycle. (A–C) Comparison of the stromal, immune, and ESTIMATE scores of tumorous and normal tissues in the TCGA dataset. (D–F) Correlation analysis between the CRGI and the stromal, immune, and ESTIMATE scores. (G) The violent plot demonstrated the comparison of the stromal, immune, and ESTIMATE scores in the high- and low-CRGI groups. (H) The heatmap demonstrated the diverse immune cell types in the infiltration process. (I) The violent plot demonstrated the comparison of the expression of the representative genes of the soundest immune checkpoints in the high- and low-CRGI groups. (J) Correlation analysis between the TIDE score and CRGI. (K) The violent plot demonstrated the comparison of the TIDE scores in the high- and low-CRGI groups. (L) Graphical demonstration of the cancer-immunity cycle. (M) Correlation analysis between the CRGI and the main steps of the cancer-immunity cycle as well as the 19 known biological processes. (N) The boxplot demonstrated the comparison of marker scores in the high- and low-CRGI groups. *, **, ***, and **** indicate the P-value thresholds 0.05, 0.01, 0.001, and 0.0001, respectively.

