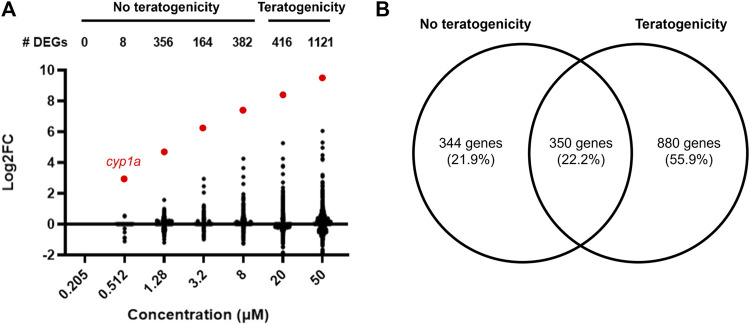
FIGURE 3.
(A) Number of differentially expressed genes and their corresponding Log2 fold change values at each retene concentration (adj. p < 0.05). Cyp1a is highlighted red. (B) Venn diagram of DEGs at concentrations with and without teratogenicity at 120 hpf. Overlapping region represents genes which were differentially expressed in at least one non-teratogenic and one teratogenic concentration.

