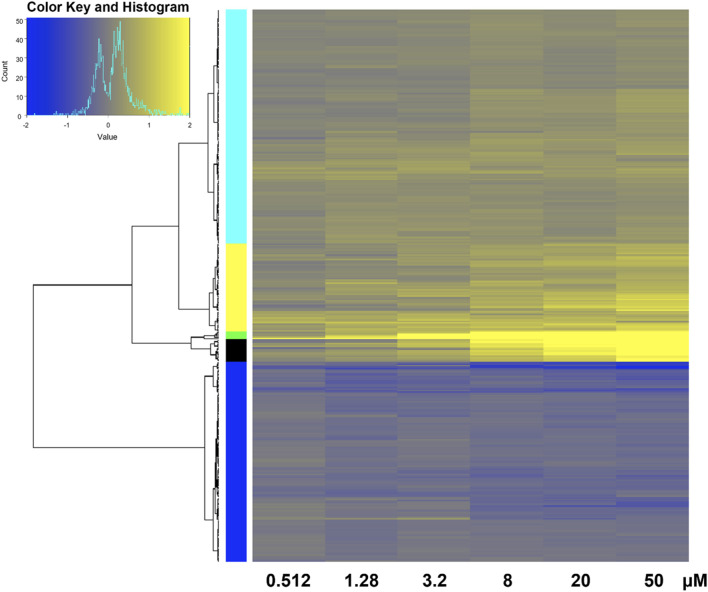
FIGURE 4.
Heatmap of transcriptomic response at each retene concentration for genes common to both non-teratogenic and teratogenic concentrations. Average Log2FC values for each gene at each treatment are displayed with yellow indicating higher expression and blue indicating lower expression compared to DMSO vehicle control. Genes are grouped by ward clustering with gene clusters on the left.

