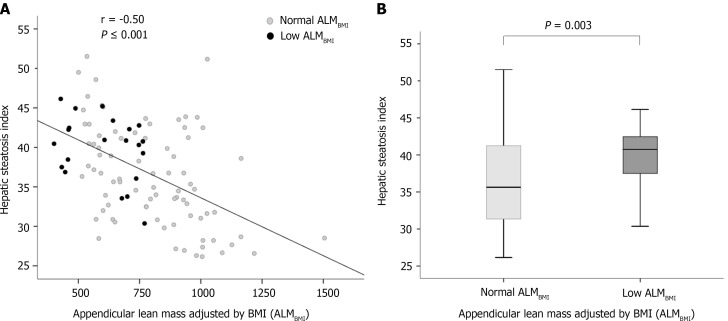
Figure 3.
Factors associated with low appendicular lean mass adjusted for body mass index. A: Correlation between hepatic steatosis index and appendicular lean mass adjusted by body mass index in patients chronically infected with hepatitis B; B: Box plots representing the hepatic steatosis index. The upper and lower limits of the boxes represent the 75th and 25th percentiles, respectively; the horizontal bar across the box indicates the median, and the ends of the vertical lines indicate the minimum and maximum data values (P = 0.003).

