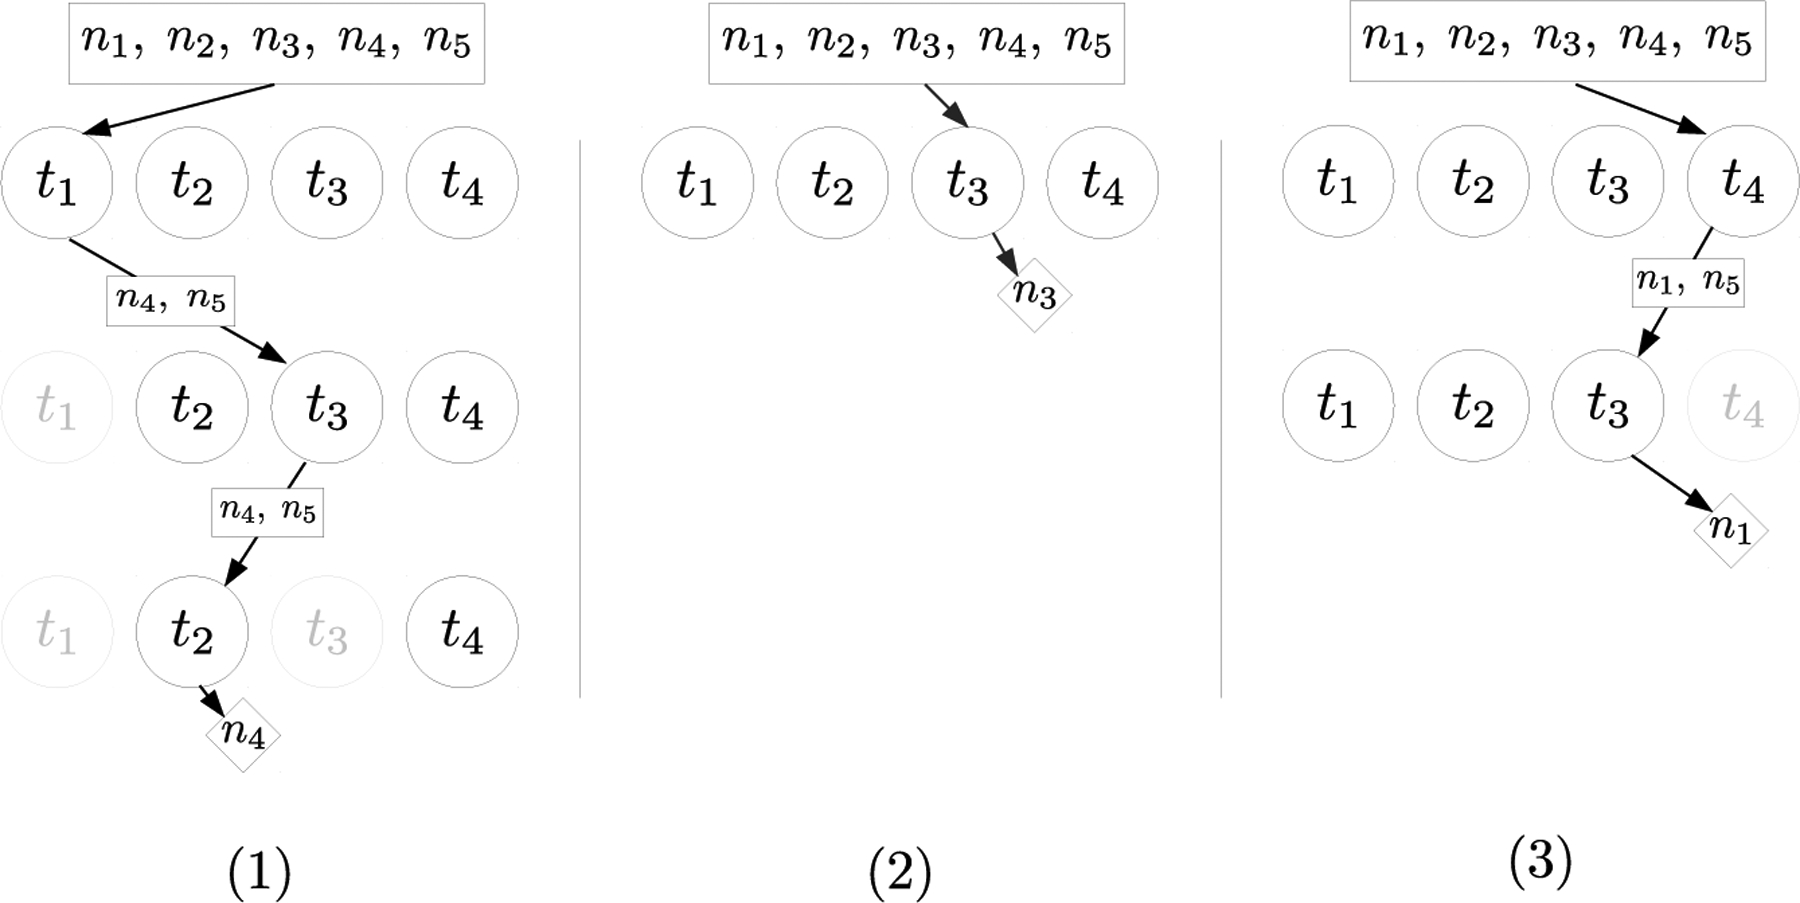
Figure 1:

A graphical representation of three parent selections using lexicase selection on the population in Table 1. The arrows indicate different selection paths through the training cases in circles. The boxes indicate the selection pool after the case performs its filtering. The diamonds show the individual selected by each selection event. Training cases in gray indicate that they have already been traversed by the current parent selection process.
