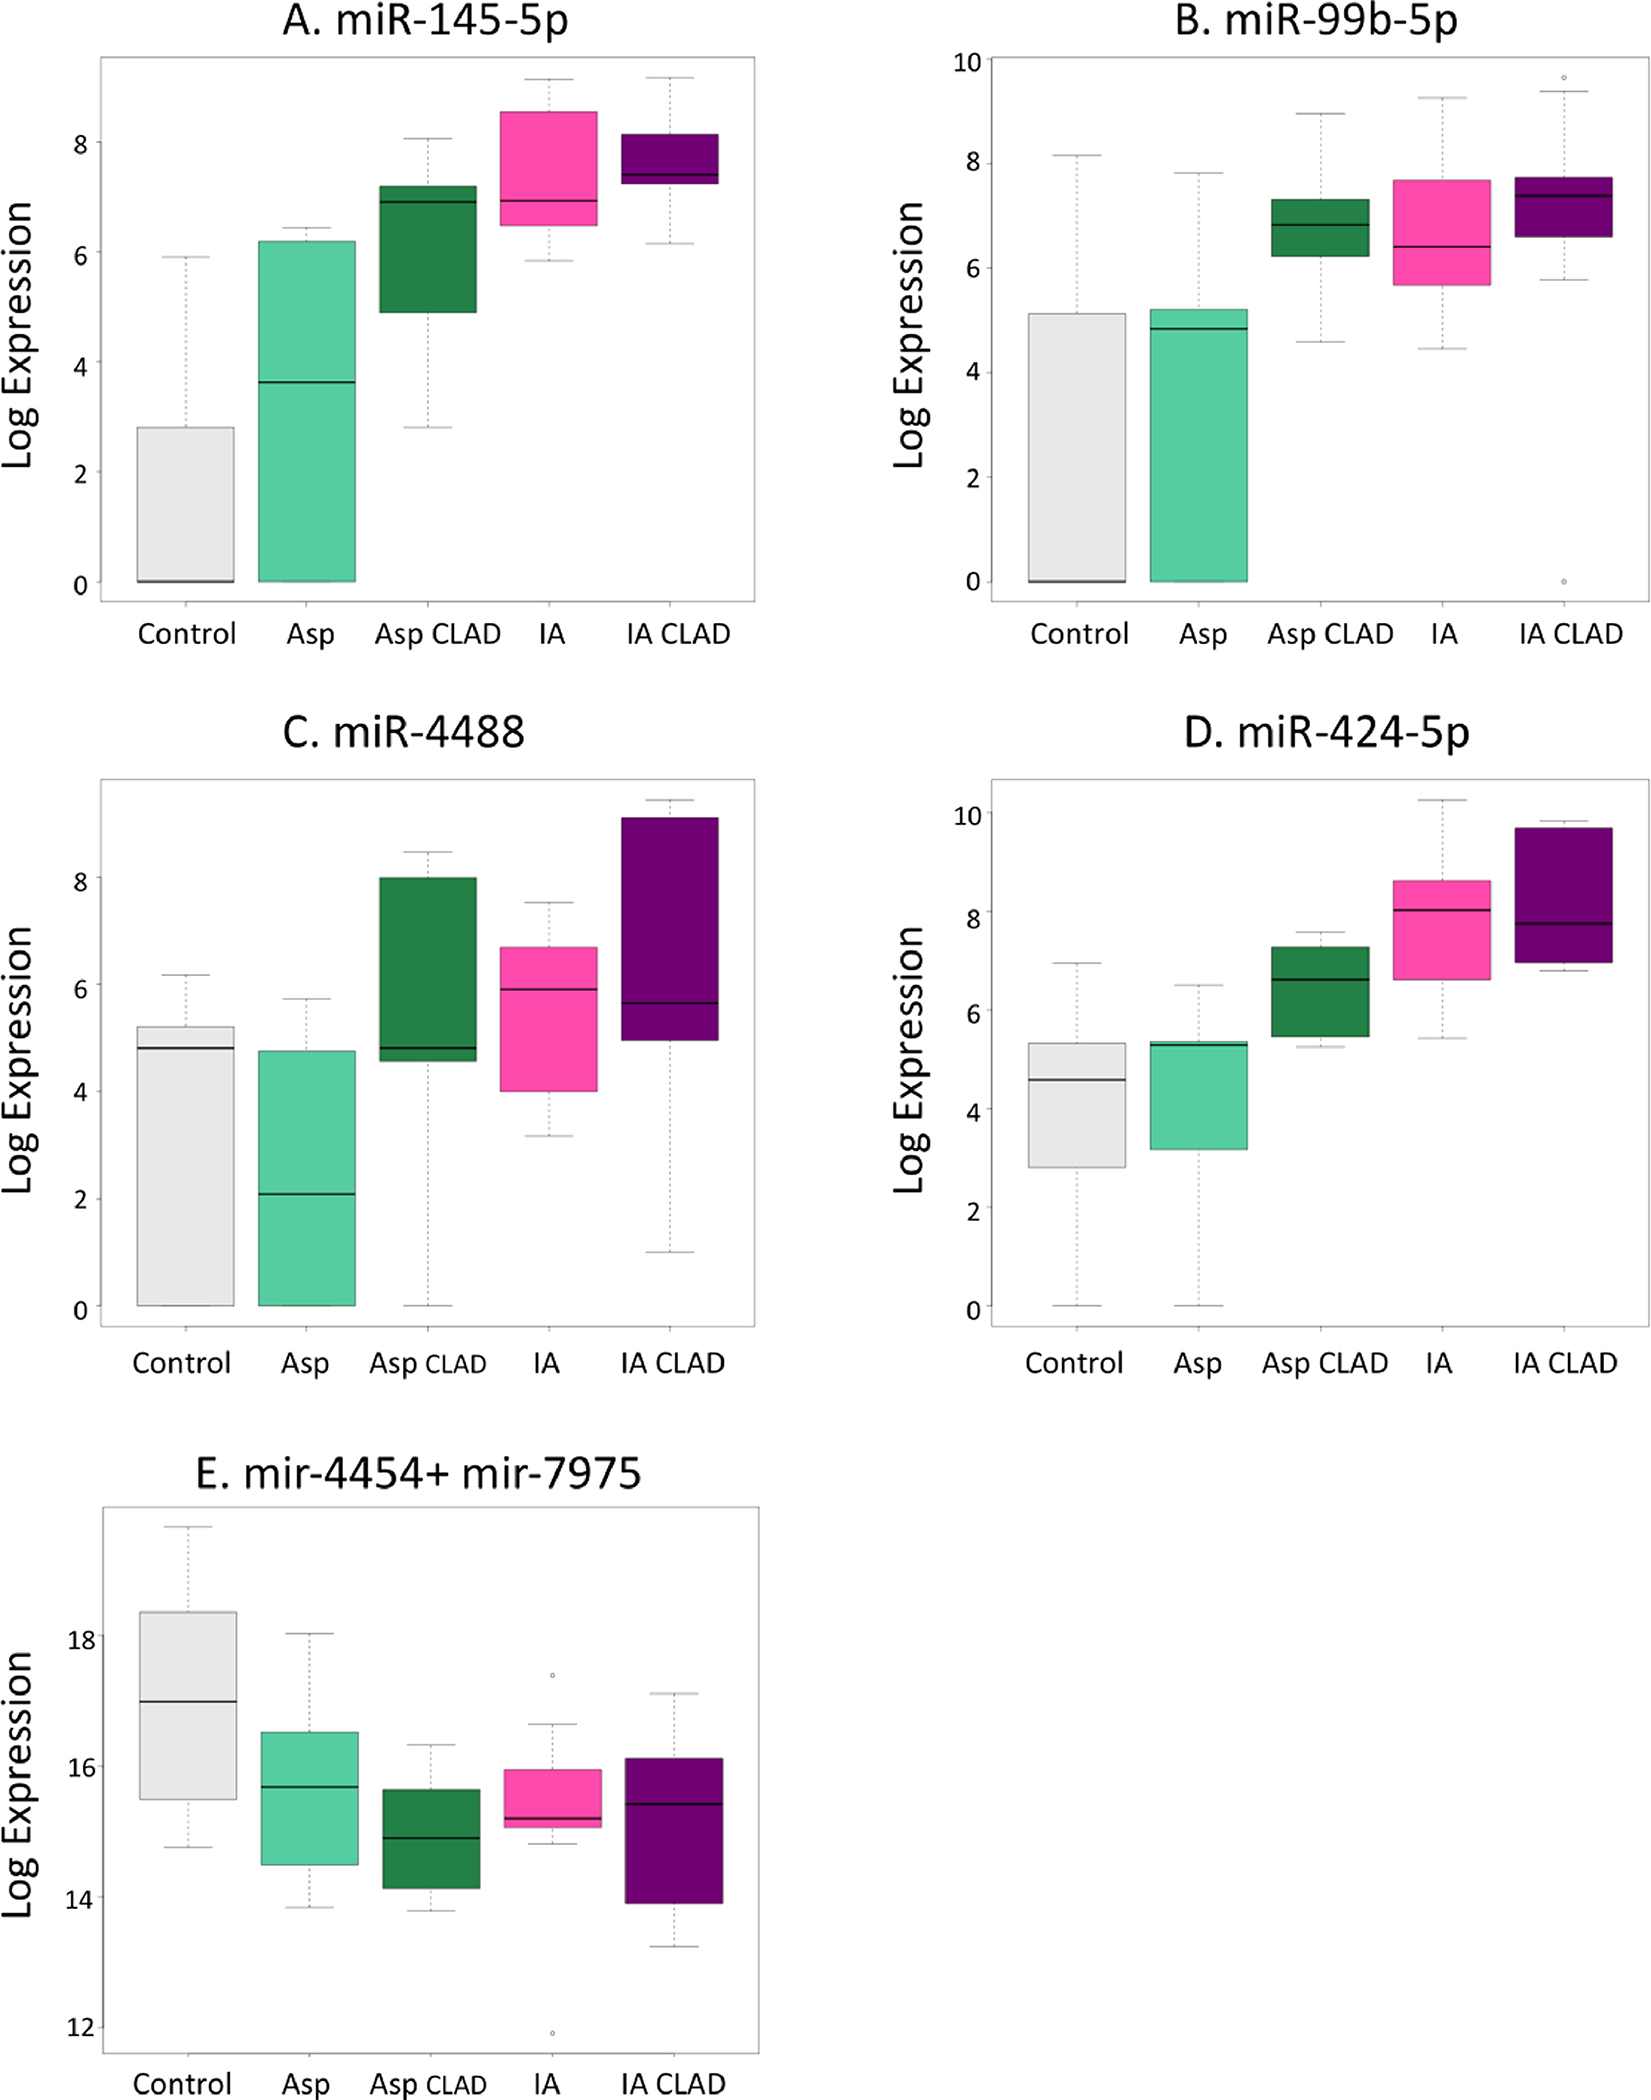
Figure 2.

Boxplots of candidate miRNA expression that are differentially expressed (more than 2 fold change and p value < 0.05) in patient group comparisons illustrated in Figure 1 and listed in Table 2. Plots (A) througt (D) show high miRNA expressions are for IA regardless of the presence of CLAD and low expression for CONTROLS and ASP only. Plot (E) slows a candidate miRNA that is down regulated for non-CONTROL samples. This represents a candidate marker to combine with the above four markers.
