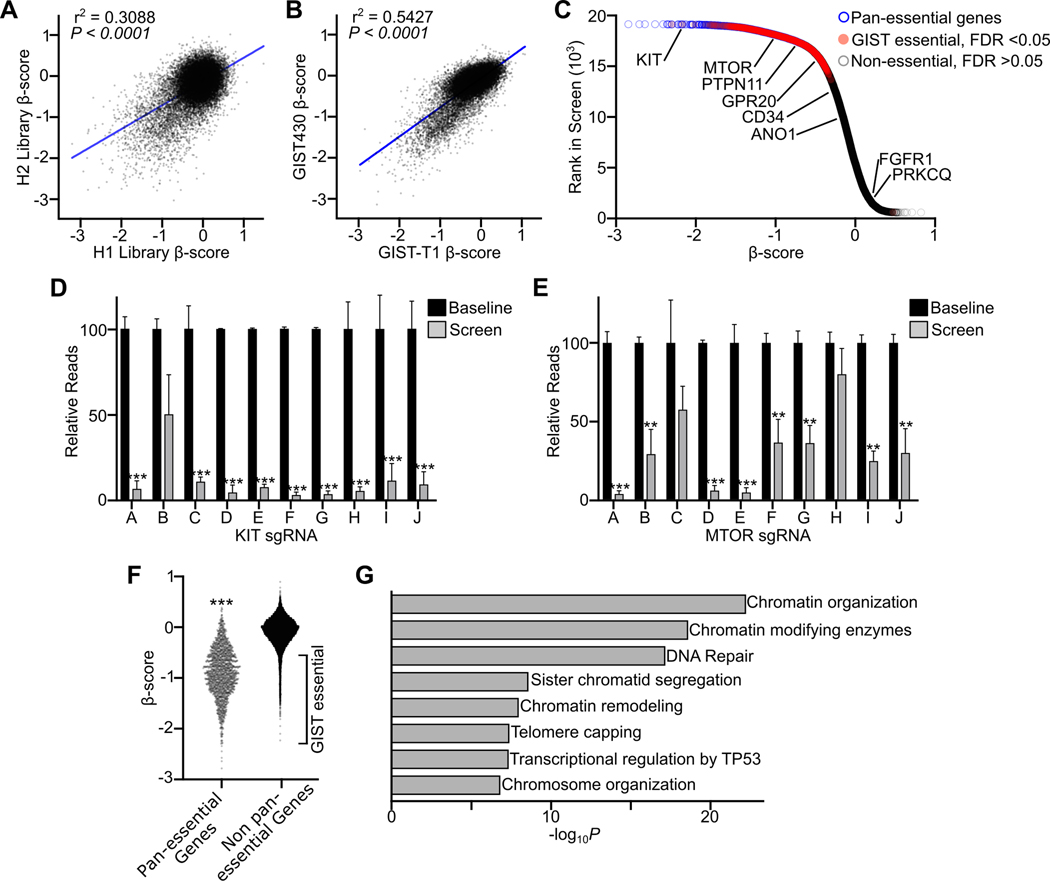
Figure 1. Identification of GIST epigenetic dependencies through genome-scale CRISPR dependency screens.
A, Correlation of β-score between H1 and H2 sgRNA libraries, each targeting 18,436 genes with 5 sgRNAs per library. Data derived from replicate screens in GIST-T1 and GIST430 cell lines were merged (per library, n=4). B, Correlation of β-score between GIST430 and GIST-T1 cell lines (per cell line, n=4 libraries). C, Plot of rank in screen and β-score merging H1 and H2 libraries and GIST cell lines. Pan-essential genes (18) are indicated in blue, genes significantly depleted in GIST but not pan-essential are in red, and non-essential genes lacking significant depletion are in gray. Select GIST-associated genes are labeled. D-E, Relative reads for individual sgRNAs targeting KIT or MTOR comparing baseline plasmid library sequencing (n=2 per library) to results at the end of the screen (n=4). F, Plot comparing β-scores of pan-essential (n=1,702) and non-pan-essential (n=16,757) genes, with GIST essential genes labeled on the plot. G, Plot showing 8 of the top 18 significantly enriched gene ontology terms among genes uniquely essential in GIST. Conditions in D, E and F were compared by t-test (compared to non-essential genes or baseline sgRNA; **, P<0.01; ***, P<0.001). Pearson correlation was performed in A and B with P value and r2 shown.

