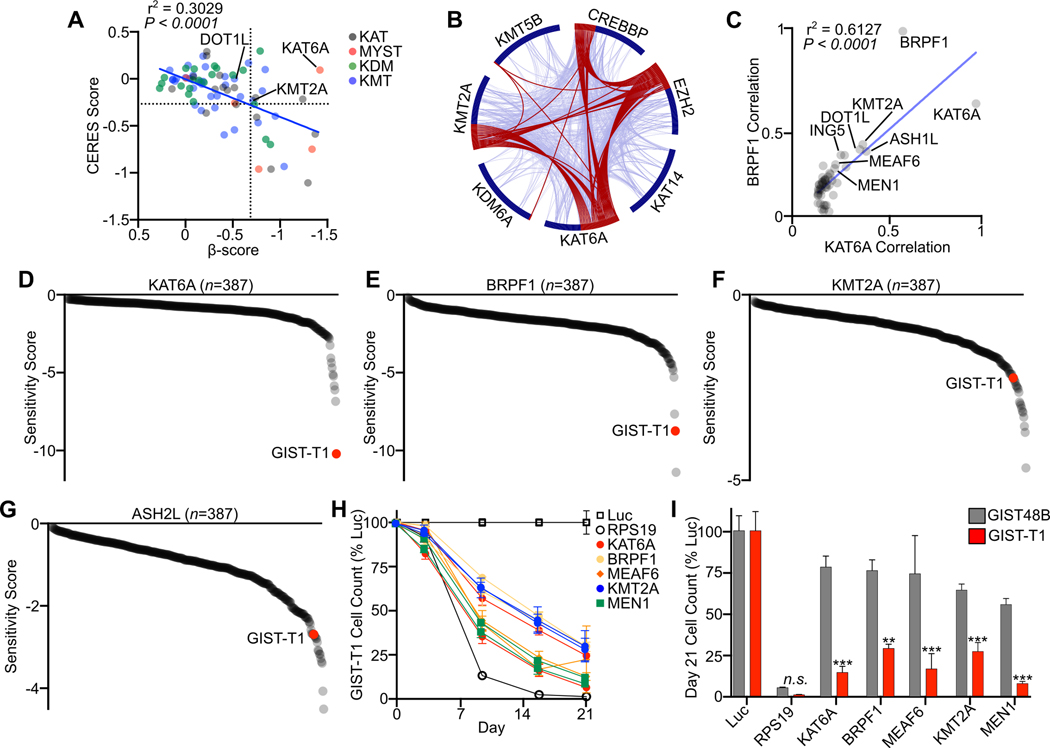
Figure 2. MOZ and Menin-MLL Complexes are Unique Co-Dependencies:
A, Plot of merged β-score in GIST-T1 and GIST430 and average CERES score of all cell lines in DepMap (n=796) for chromatin modifying enzymes (n=77) including lysine acetyltransferases (KAT), MYST type domain containing lysine acetyltransferases (MYST), lysine demethylases (KDM) and lysine methyltransferases (KMT). The dotted lines divide the plot into quadrants, with the right upper quadrant containing 7 genes that were dependencies in GIST but not common dependencies across DepMap cell lines. B, Circos plot showing overlap of the top 50 DepMap correlated dependencies of the seven chromatin modifying enzymes with enriched dependencies in GIST. Red lines connect genes shared on multiple co-dependency lists. Blue lines connect genes that fall into the same ontology term. C, Top 50 gene dependency correlations between KAT6A and BRPF1 in DepMap. Co-dependent chromatin modifying enzymes and complex members are labeled. D-G, Ranked Sensitivity Score from Project Drive cell lines (n=387) for MOZ complex members KAT6A and BRPF1 and Menin-MLL complex members KMT2A and ASH2L, with GIST-T1 highlighted in red. H, Growth over time assay following transduction of the indicated sgRNAs targeting Menin-MLL and MOZ complex members in GIST-T1, with two independent sgRNAs per gene. sgRNAs targeting Luc and RPS19 are shown in open boxes and circles, respectively (n=3 per sgRNA). I, Day 21 cell count in a growth over time assay comparing GIST-T1 to GIST48B (n=6 per gene from two sgRNAs). Data were analyzed by two-way ANOVA with Tukey’s multiple comparisons test, compared to GIST48B in the same treatment condition; ***,P<0.001; **,P<0.01. The Pearson correlation coefficient is shown in A and C.

