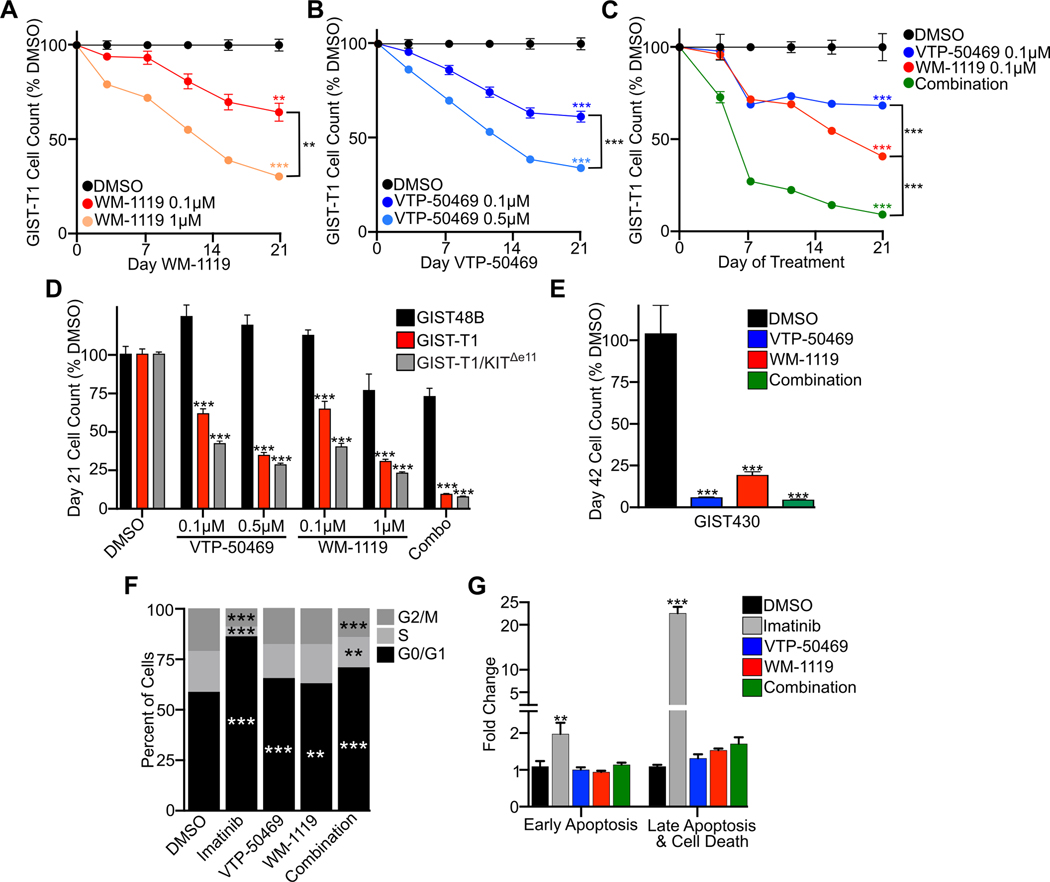
Figure 4. Inhibition of MOZ and Menin-MLL Complexes leads to cell cycle arrest.
A, Growth over time assay in GIST-T1 with the indicated concentrations of KAT6A inhibitor WM-1119. B, Growth over time assay in GIST-T1 with the indicated concentrations of Menin inhibitor VTP-50469. C, Growth over time assay in GIST-T1 treated with WM-1119, VTP-50469 or combination treatment at 0.1 μM of each inhibitor. D, Day 21 cell count normalized to DMSO following treatment of GIST48B, GIST-T1 or KIT enhancer independent cell line GIST-T1/KITΔe11 (with endogenous KIT knocked out with rescue of CMV promoter driven mutant KIT) treated with the indicated inhibitors. Statistical comparisons reference GIST48B under the identical treatment. E, Growth over time assay in GIST430, with relative cell count shown at day 42 following treatment with VTP-50469 at 0.5 μM, WM-1119 at 1 μM or the combination with each drug at 0.1 μM. F, Cell cycle analysis showing the percentage of cells in G0/G1, S or G2/M comparing DMSO to 72 hours imatinib or 8 days of VTP-50469 at 0.5 μM, WM-1119 at 1 μM or the combination with each drug at 0.1 μM. G, Fold change compared to DMSO control of cells in early apoptosis or late apoptosis and cell death following 72 hours treatment with imatinib at 0.5 μM or 8 days of VTP-50469 at 0.5 μM, WM-1119 at 1 μM or the combination with each drug at 0.1 μM (n=3–5 per condition). Data were analyzed by two-way or one-way ANOVA, where appropriate, with Tukey’s post-hoc test, compared to DMSO or the indicated condition; ***,P<0.001; **,P<0.01.

