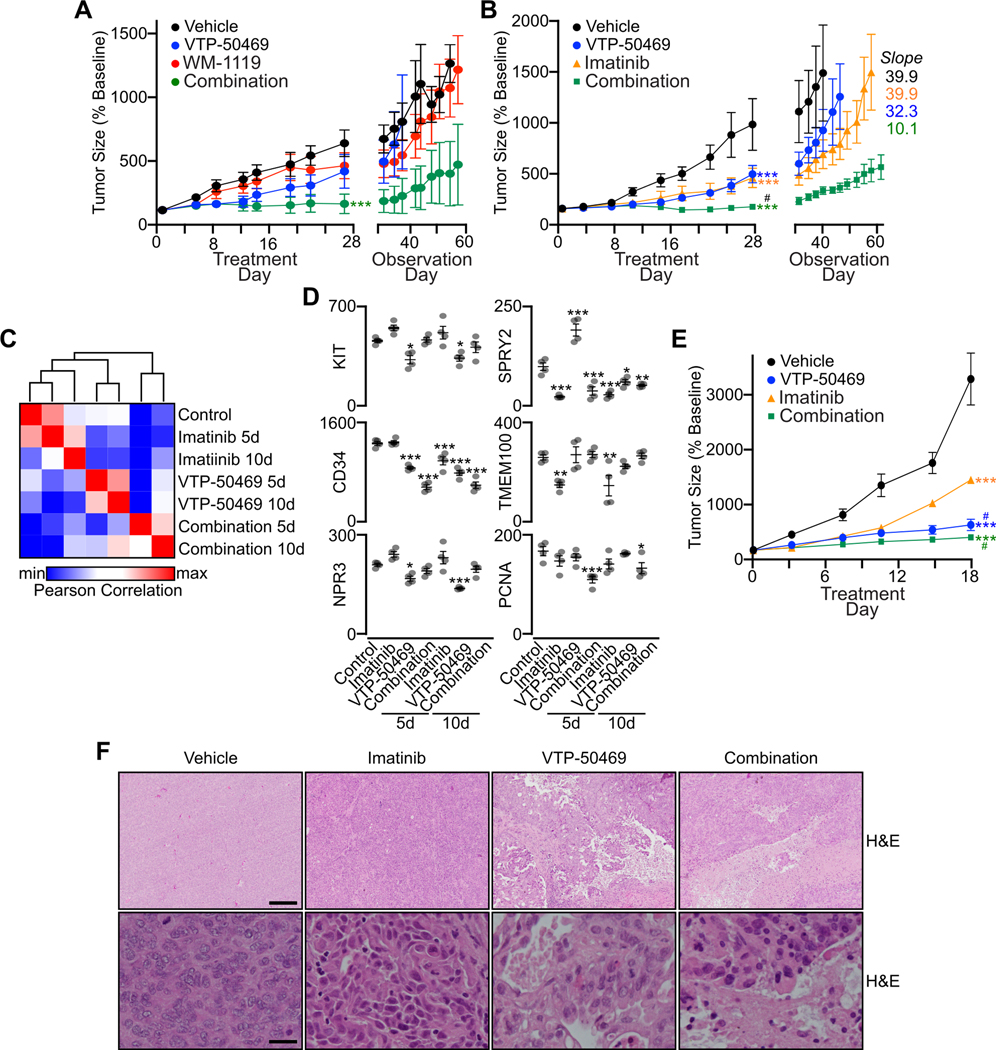
Figure 7. Menin and MOZ disruption regulates GIST growth in vivo.
A, GIST-T1 cell line xenografts were treated for 28 days with WM-1119 (50 mg/kg gavage three times daily, 7d/week; n=6), VTP-50469 (0.1% in chow; n=5), combination WM-1119 and VTP-50469 (n=6) or vehicle control (n=5). After the 28 day treatment period, tumors were continuously measured to monitor for recovery of growth. Data were analyzed by two-way ANOVA, compared to vehicle; ***,P<0.001. B, GIST-T1 cell line xenografts were treated for 28 days with imatinib (50 mg/kg gavage 5d/week; n=5), VTP-50469 (0.1% in chow; n=4), combination imatinib and VTP-50469 (n=5) or vehicle control (n=5). After the 28 day treatment period, tumors were continuously measured to monitor for recovery of growth. Data were analyzed by two-way ANOVA, compared to vehicle; ***,P<0.001; compared to monotherapy; #,P<0.01. C, Data from RNA-seq performed on GIST-T1 cell line xenografts treated for 5 or 10 days with imatinib (50 mg/kg gavage 5d/week; n=4), VTP-50469 (0.1% in chow; n=4), combination imatinib and VTP-50469 (n=4) or vehicle control (n=4) with heatmap showing the Pearson correlation of group-averaged FPKM of all expressed genes (FPKM >10, n=7,434). D, Expression in FPKM of select genes associated with GIST lineage, imatinib regulation or cell proliferation. Data were analyzed by one-way ANOVA with Dunnett’s multiple comparisons test, compared to Control; ***,P<0.001; **,P<0.01; *,P<0.05. E, PG27 PDX were treated for 18 days with imatinib (50 mg/kg gavage 5d/week; n=5), VTP-50469 (0.1% in chow; n=5), combination imatinib and VTP-50469 (n=5) or vehicle control (n=5). Data were analyzed by two-way ANOVA, compared to vehicle; ***,P<0.001; compared to imatinib; #,P<0.01. F, PG27 tumors were harvested at the end of the treatment period and fixed tissues sectioned and stained with H&E. Representative images are shown from treatment groups at 4x (upper panels, scale bar = 250 μm) and 40x (lower panels, scale bar = 25 μm).

