Figure 1.
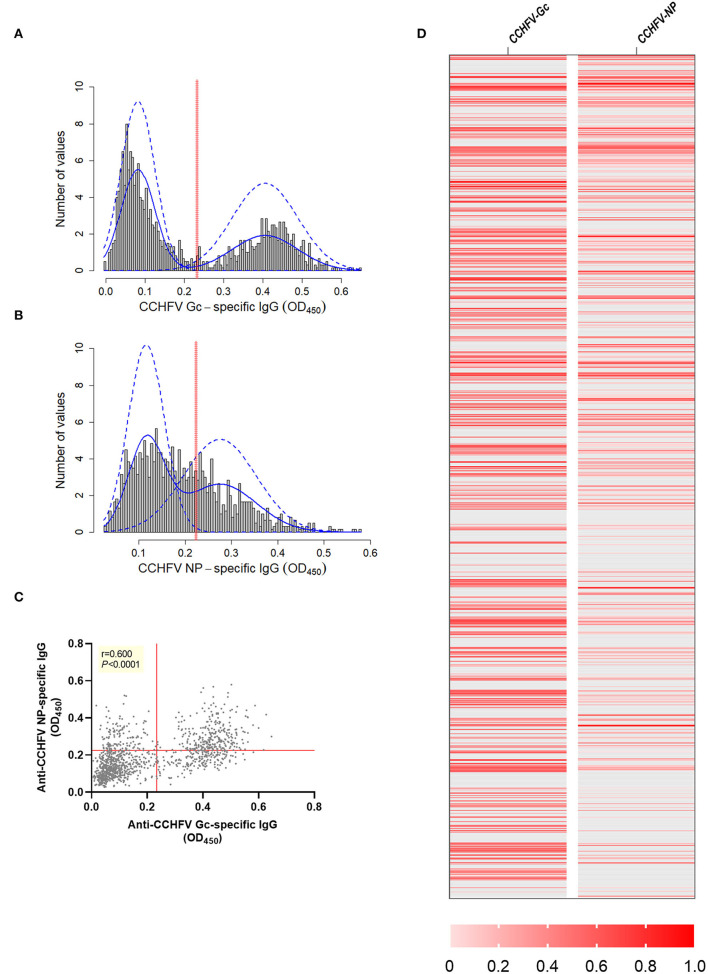
CCHFV Gc-specific and CCHFV NP-specific IgG sero-reactivity in sheep sera from endemic CCHFV areas. Sheep sera were collected as part of a cross-sectional study in an endemic CCHFV area (Bulgaria, n = 1,200) and tested for anti-CCHFV Gc-specific IgG levels (A) and anti-CCHFV NP-specific IgG levels (B) by in-house ELISAs. Data are represented as a histogram of the distribution of the OD450 values frequency (gray bars). Non-parametric estimation of the distribution (solid blue lines) and finite-mixture model (dashed blue lines) with estimated cut-off (red solid line). (C) Relationship between levels of anti-CCHFV Gc-specific and anti-CCHFV NP-specific IgG represented as correlation analysis (Spearman rank test) with red solid lines representing the estimated cut-off by finite mixed model. (D) Heatmap of data normalized across anti-CCHFV Gc and anti-CCHFV NP-specifc IgG using min-max normalization where minimum was defined as the cut-off specific for the assay as descriptive representation of the correlation at individual level. Each row represents data from one animal. Animals below the cut-off represented as gray and animals above the cut-off as different shades of red defined in the legend.

