Figure 5.
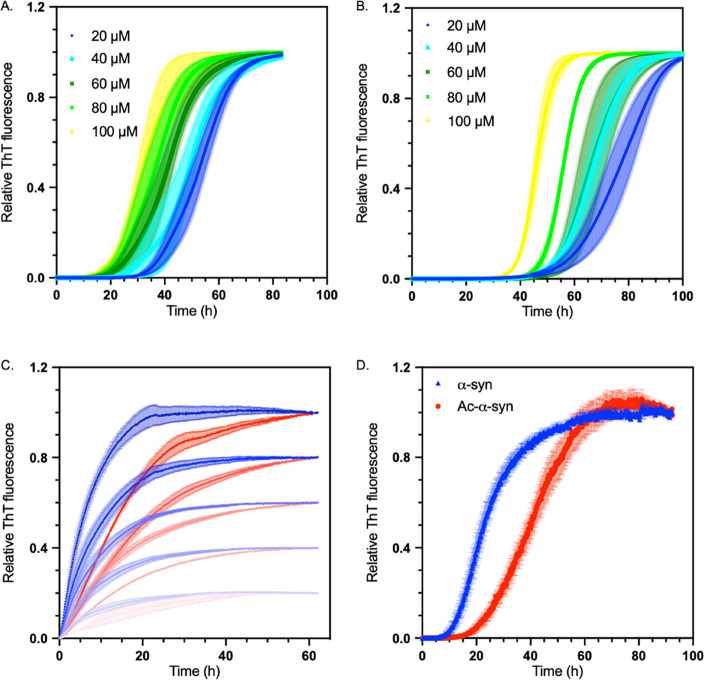
N-terminal acetylation delays secondary processes and fibril elongation of α-synuclein (A) Representative time courses of surface-catalyzed fibril amplification of the non-acetylated α-synuclein monomer seeded by non-acetylated α-synuclein fibrils. (B) Representative time courses of surface-catalyzed fibril amplification of the acetylated α-synuclein monomer seeded by acetylated α-synuclein fibrils. (A, B) Data were normalized to the end-point ThT fluorescence values for each reaction. Increasing initial concentrations of α-synuclein monomers added to the reaction are shown: 20 μM (dark blue), 40 μM (light blue), 60 μM (dark green), 80 μM (light green), and 100 μM (yellow). Aggregation conditions were as follows: 20 mM NaPO4 buffer, pH 4.8, 50 nM seeds, under quiescent conditions; error bars represent SEM, over three replicates. (C) Representative time courses of fibril elongation of the non-acetylated α-synuclein monomer seeded with non-acetylated α-synuclein fibril (blue) and acetylated α-synuclein monomer seeded with acetylated α-synuclein fibril (red). Increasing concentrations are represented by increasing color, with 20 μM represented as the lightest and 40, 60, 80, and 100 μM as the darkest. Aggregation conditions were as follows: 20 mM NaPO4 buffer, pH 6.5, 2.5 μM seeds, under quiescent conditions at 37 °C. (D) Analysis of aggregation in an unseeded shaking reaction of non-acetylated α-synuclein (blue triangle) and acetylated α-synuclein (red dot); error bars represent the SEM with n = 3.

