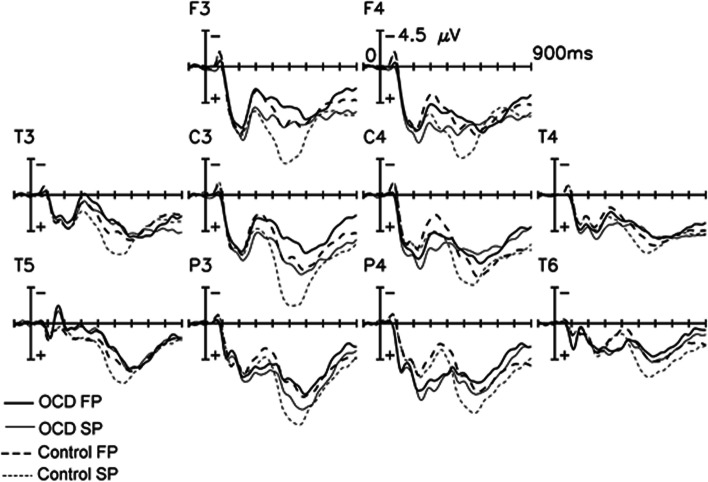
Fig. 1.
ERPs comparing OCD patients and controls. Grand average ERP waveforms to correctly detected first and second presentations of the words for the OCD group (n = 16) and the normal controls (n = 12) at F3, F4, C3, C4, P3, and P4. The second presentations of words elicited a more positive-shift starting at about 220 ms after the onset of the stimulus and extending for the rest of the recording epoch. This old/new effect is widespread and has a left frontocentral maximum. The patients showed reduced late old/new effect (ca. 450–650 ms) compared to the controls. FP = first presentation, SP = second presentation

