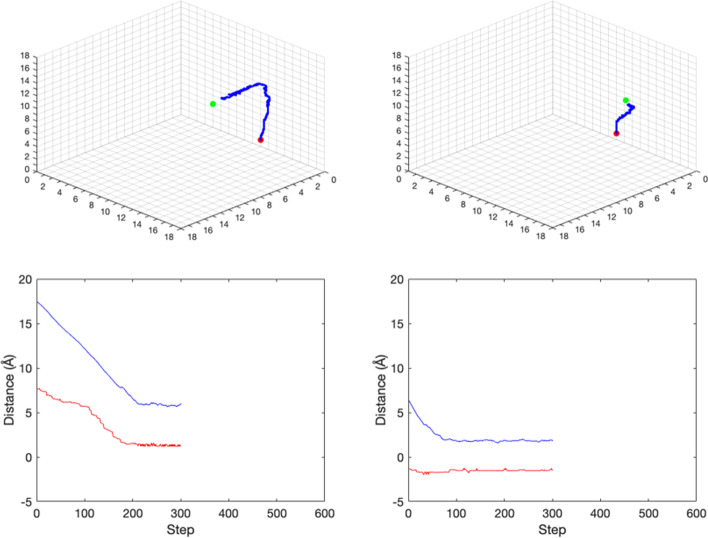
Fig. 8.
The actor model and critic model performances of Cu-ligand dataset in the test process. Upper left: The searching path in episode 2000. Upper right: The searching path in episode 4000. The red point is the start ligand site, the green point is the true ligand site, and the blue path is the searching path. Environment atoms are not presented in plots. Lower left: The critic distances and the real distance in episode 2000. Lower right: The critic distances and the real distance in episode 4000. The red curve is the critic model predicted distance between the current state and the true ligand site. The blue curve is the real distance between the current state and the true ligand site. The X-axis denotes the step number in the episode. The Y-axis denotes the distance value. Because of the stop criterion, different episodes may have different step numbers

