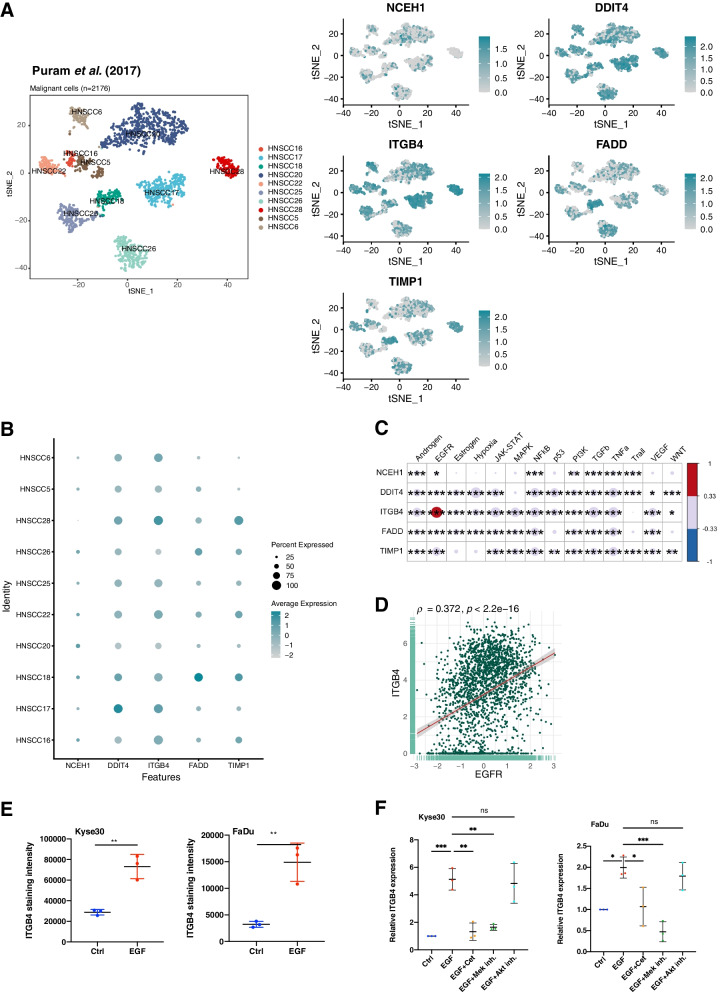
Fig. 6.
5-gene signature expression in malignant single HNSCC cells. A T-distributed stochastic neighbor embedding (t-SNE) plots of malignant single HNSCC cells (n = 2176; GSE103322; left plot). Expression of NCEH1, DDIT4, ITGB4, FADD, and TIMP1 are displayed in t-SNE plots in n = 2176 malignant single cells (right plots). B 5-gene signature expression is represented for individual patients with percent of malignant single cell expression and average expression values. C Pathway activities of malignant single cells from GSE103322 were inferred using PROGENy. Spearman correlations and p-values of the 5-gene signature with pathway activities are depicted. * ≤ 0.05; ** ≤ 0.01; *** ≤ 0.001. D Scatter plots of ITGB4 correlations with the EGFR pathway in n = 2176 malignant single cells from GSE103322 are shown with Spearman correlation and p-value. E ITGB4 cell surface protein expression is shown in Kyse30 and FaDu cells treated with 50 ng/mL EGF for 72 h. Mean values with SD are shown in scatter dot plots of n = 3 independent experiments. ** ≤ 0.01 (t-test). F ITGB4 mRNA expression in Kyse30 and FaDu cells treated with 50 ng/mL EGF or combinations of EGF with Cetuximab, MEK inhibitor, or AK inhibitor. Mean values with SD of qPCR measurements are shown in scatter dot plots after 72 h of the indicated treatment of n = 3 independent experiments. * ≤ 0.05; ** ≤ 0.01; *** ≤ 0.001 (one-way ANOVA)

