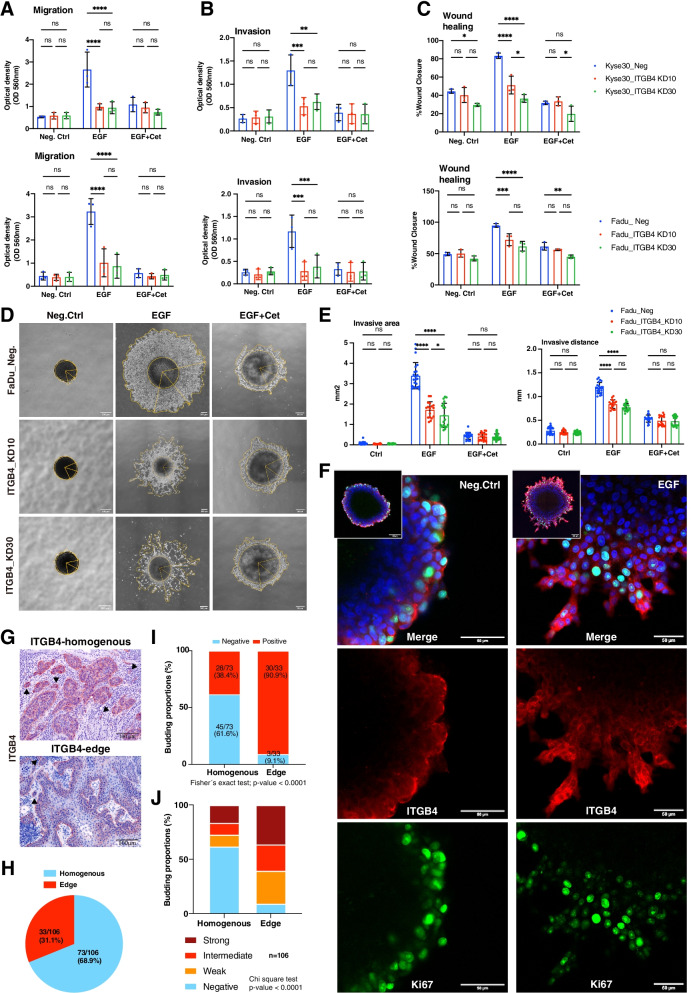
Fig. 7.
ITGB4 promotes migration and invasion of HNSCC cells. A-B Control and ITGB4 knock-down cells were analyzed in migration (A) and invasion assays with inlays coated with Matrigel (B) in a Boyden chamber. Mean and SD are shown in scatter dot plots of n = 3 independent experiments. * ≤ 0.05, ** ≤ 0.01; *** ≤ 0.001, **** ≤ 0.0001. C Control and ITGB4 knock-down cells were analyzed in wound healing assays. Wound closure was quantified after 24 h and 48 h for Kyse30 and FaDu cells, respectively. Mean and SD are shown in scatter dot plots of n = 3 independent experiments. * ≤ 0.05, ** ≤ 0.01; *** ≤ 0.001, **** ≤ 0.0001. D FaDu control (Neg.) and ITGB4_KD cells (KD10 and KD30) spheroids were cultured in Matrigel under serum-free conditions. Spheroids were left untreated (Neg.Ctrl), treated with EGFhigh, or treated with a combination of EGFhigh and Cetuximab. Representative images of n = 3 independent experiments with multiple spheroids are shown. E Invasive area representing the outer rim of cells (see yellow lines in D) and invasive distance representing the mean distance covered by 10–15 most invasive single cells were quantified. Mean and SD are shown in scatter dot plots of n = 3 independent experiments where each dot represents one spheroid. **** ≤ 0.0001. F Representative immunofluorescence confocal images of ITGB4, Ki67, and nuclei in peripheral cells of control- and EGF-treated FaDu spheroids are shown. Merged pictures of the full spheroids are shown in inlays. G Examples of tumor budding are shown for HNSCC with homogeneous or edge-localized ITGB4 expression. H Proportions of homogeneous and edge localization of ITGB4 in n = 106 HNSCC. I Budding proportions of HNSCC are depicted for tumors with homogeneous or edge localization of ITGB4 (n = 16). J Proportions of budding intensities of HNSCC are depicted for tumors with homogeneous or edge localization of ITGB4 (n = 16)

