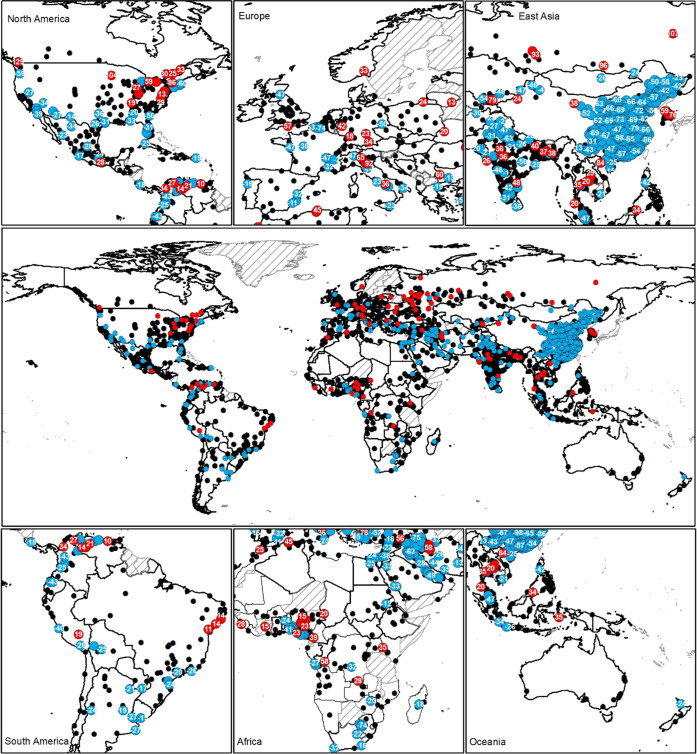
Figure 4.
Percent change in Sentinel 5P satellite observed NO2 across 1736 world cities under stringent CRPs compared to the pre-CRP from January 1st, 2019, to July 31st, 2020. The cities in blue color had a statistically significant reduction, while red-colored cities had statistically significant increases. The black-colored cities had no significant difference in NO2 before or after the implementation of COVID-19 stringent CRPs. The crosshatched countries/territories had no data on stringent policy interventions in Oxford’s COVID-19 Government Response Tracker.

