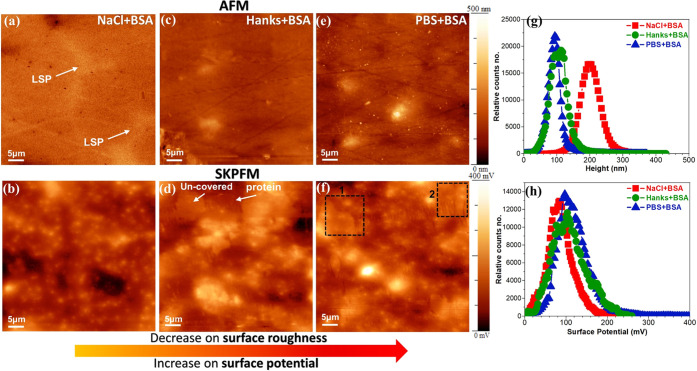
Figure 9.
AFM (first row) and SKPFM (second row) images of the WE43 Mg alloy after 10 min of immersion in (a, b) 0.9% NaCl + 4 g L–1 BSA, (c, d) Hanks + 4 g L–1 BSA, and (e, f) PBS + 4 g L–1 BSA physiological solutions at 37 °C, pH 7.4, and aerated conditions. (g) Height and (h) surface potential histograms that are related to SKPFM images in (b), (d), and (f).

