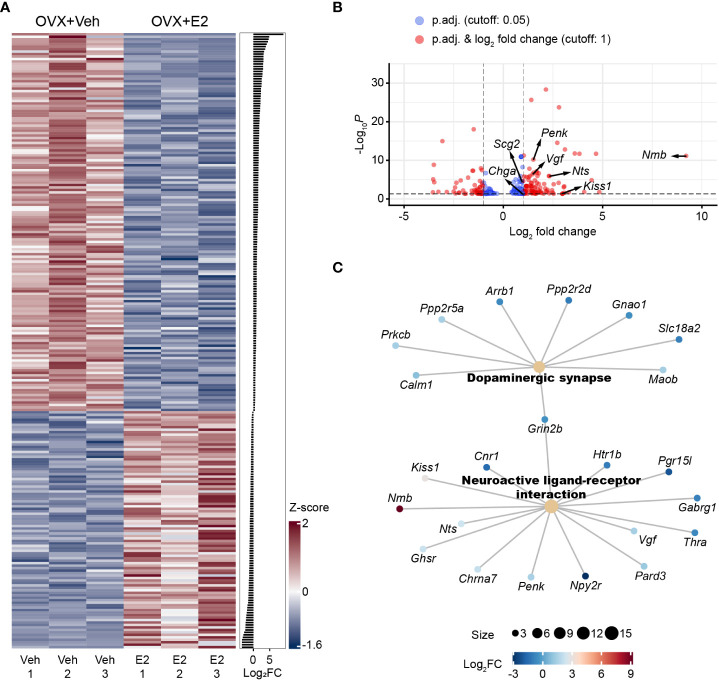
Figure 1.
Estrogenic regulation of the KPRP3V neuron transcriptome. Heat map of all E2-dependent transcripts. Transcripts were arranged by size of fold change (FC). We used z-score values to illustrate the size of transcriptional changes, and the values are color coded. z-score is calculated from the CPM value, the mean CPM and the standard deviation of CPM values in a given experimental group (A). Volcano plot reveals 132 regulatory changes that exceed |log2FC| 1.0. Transcriptional changes of neuropeptides (Nmb, Kiss1, Nts, Penk) and granins (Chga, Scg2, Vgf) were marked (B). Overrepresentation analysis (ORA) of E2-dependent genes identified significant changes in the dopaminergic synapse and the neuroactive ligand-receptor interactions KEGG pathways. The number of genes in a given pathway is reflected in the size of the dot for the pathway. E2-induced changes of individual genes are color coded based on log2FC values (C).

