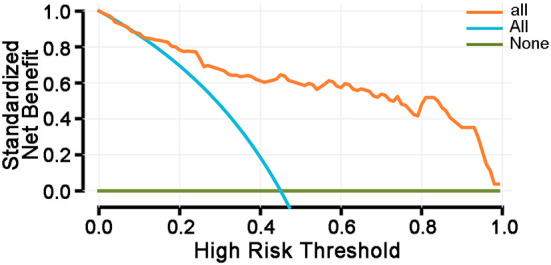
Figure 5.

Decision curve analysis. Survival rates (net benefit rates) were compared for three different decisions. The three curves represent: (1) all patients have no factors that influence the risk of developing PTCI (represented by NONE, horizontal line), (2) all patients are at risk of developing PTCI (represented by ALL, slash), and (3) he decision curve of this study. This prediction model can be used for clinical decision-making. Thresholds are in the range of <85%, and the model has a higher survival rate (net benefit rate) relative to ALL or NONE.
