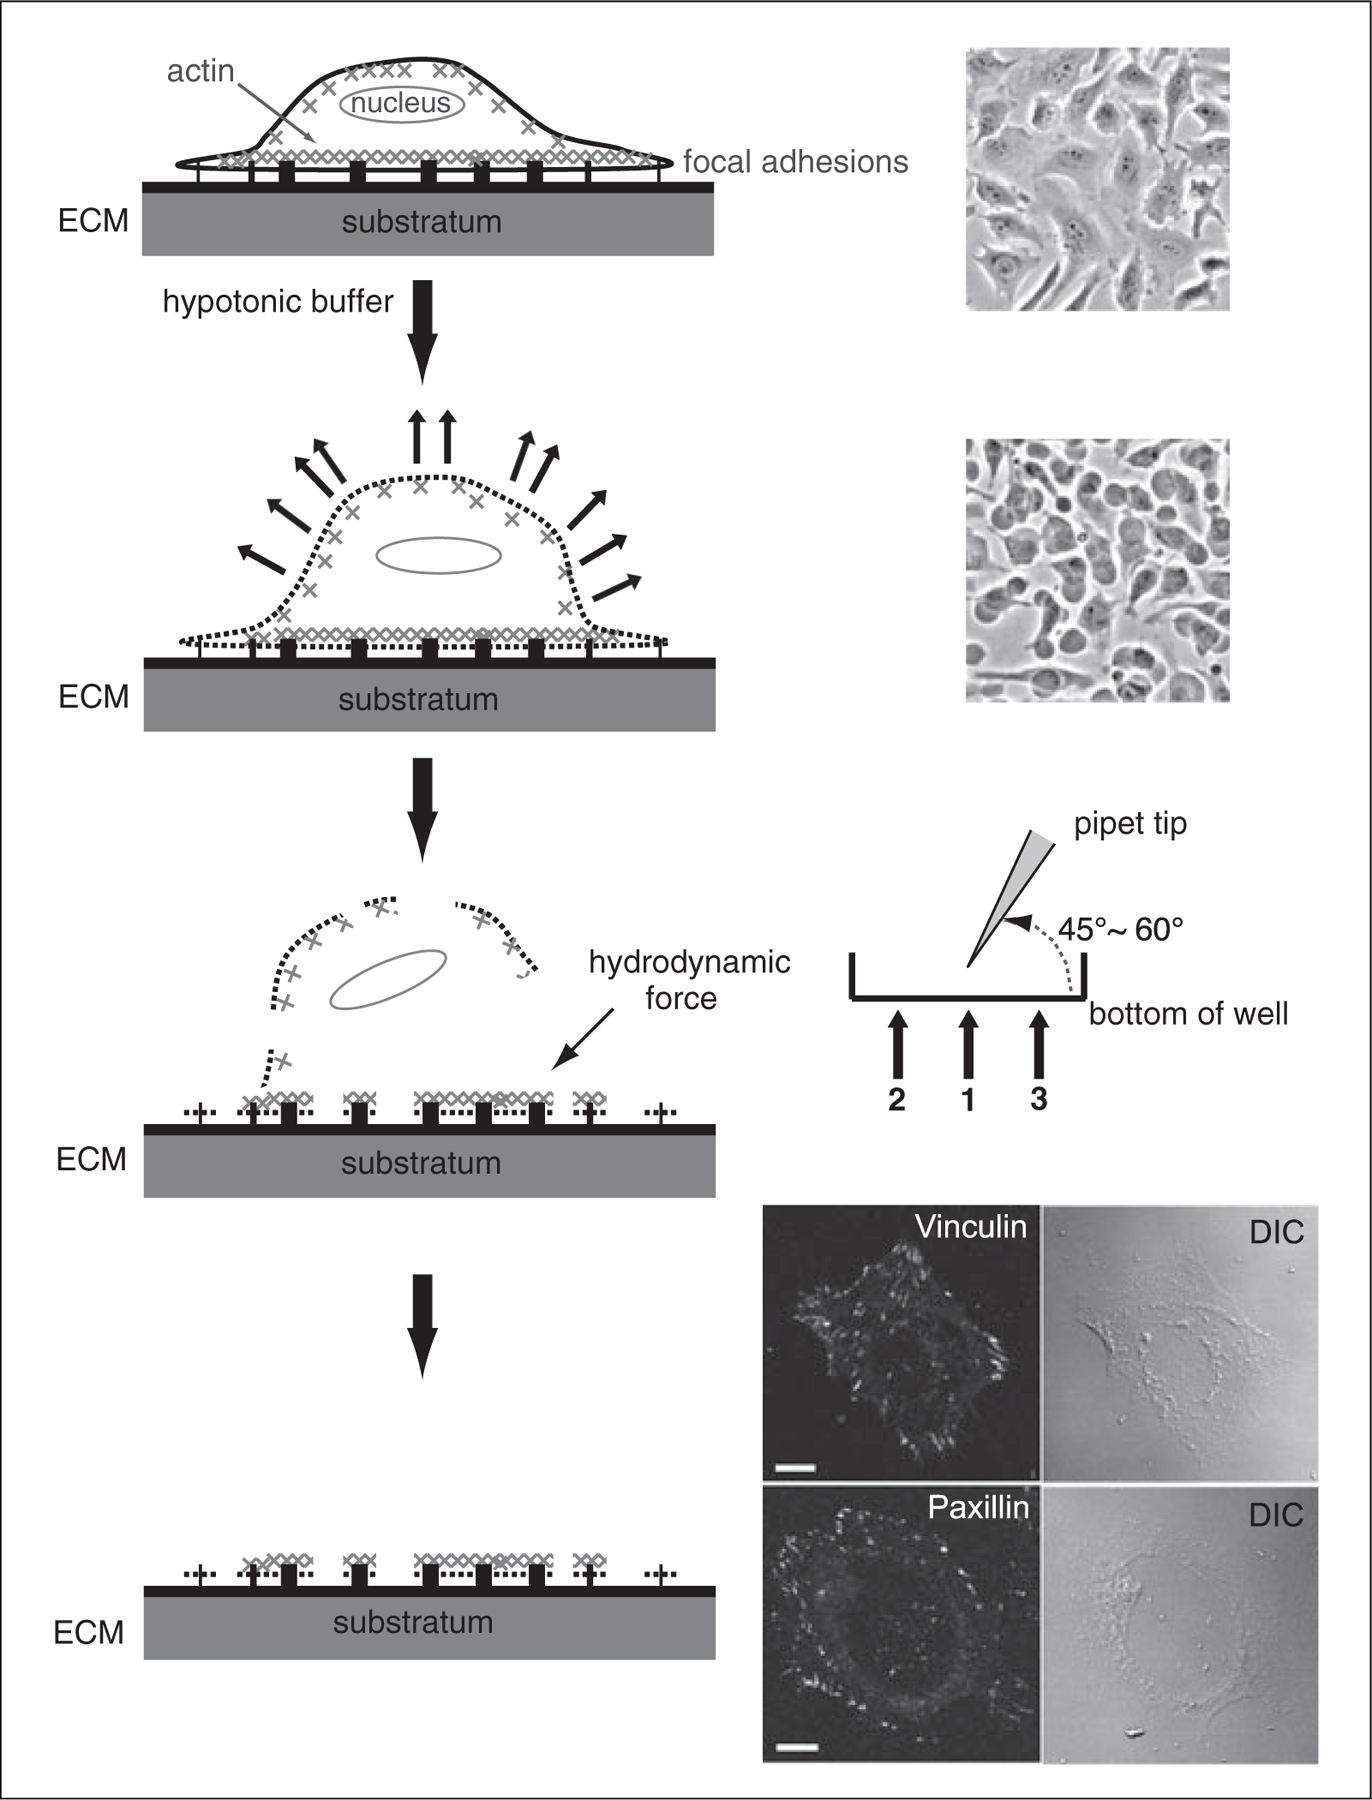
Figure 17.13.2.

The procedure of FA isolation. Left panel, schematic diagram of the FA isolation procedure. Right panel, representative images of cells at each step (top to bottom). Phase contrast images of HeLa cell morphology before and after incubation with hypotonic lysis buffer. Cells appear swollen but do not detach from the substratum after 5 min of treatment. The position of the repetitive pipettor tip for each wash labeled as 1, 2, 3. The FA fraction is validated by the loss of nuclei and cell bodies (DIC) and the preservation of FAs shown by vinculin and paxillin immunofluorescence staining. Scale bar, 10 μm.
