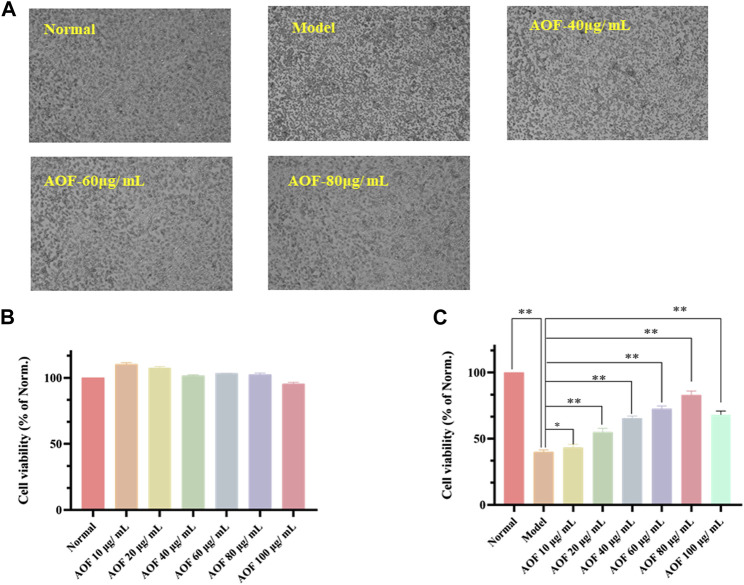
FIGURE 6.
Protective effects of AOF on the cell viability of H2O2-stimulated PC12 cells (A) The represented cell morphology of PC12 cells with different treatment (B) Effects of AOF on cell viability of normal PC12 cell (C) Effects of AOF on cell viability of H2O2-stimulated PC12 cells under different concentration. The values were represented as the mean ± SD (n = 3). *p < 0.05, **p < 0.01 vs the model group.

