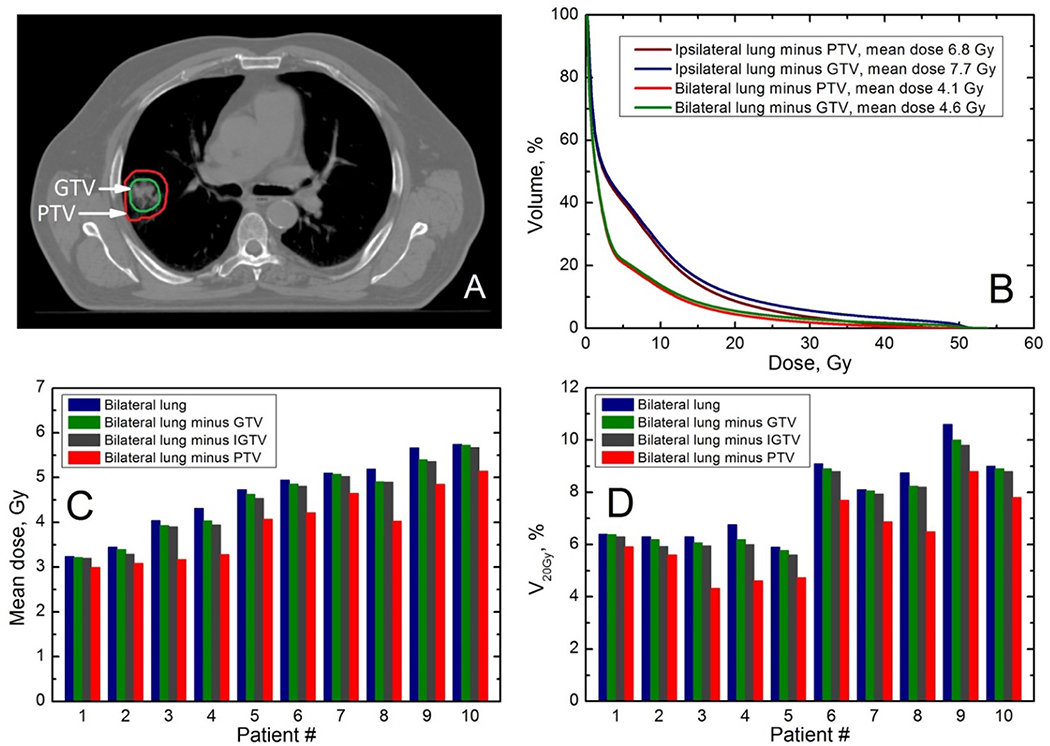
Figure 1. Variance in normal lung definition and examples of its effect on lung dose volume histograms (DVH).
DVH vary with the kind of target subtracted from the lung. Panel A shows an axial slice with PTV contour in red and GTV in green; panel B shows DVH for ipsilateral lung with either PTV (purple line) or GTV (blue line) subtracted and bilateral lung with either PTV (red line) or GTV (green line) subtracted Panels C and D show mean doses and V20 for 10 patients for bilateral lung with either GTV or PTV subtracted. GTV= Gross Tumor Volume. IGTV=internal GTV, i.e. composite GTV of all phases of 4DCT. IGTV=ITV when CTV margin is zero. PTV = Planning Target Volume.

