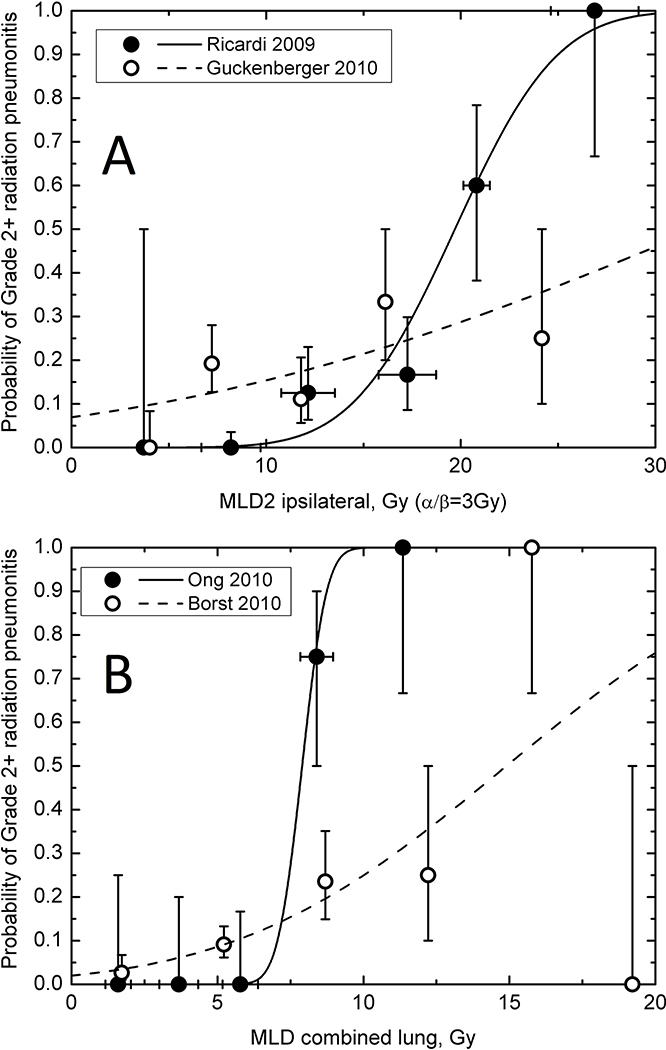
Figure 3. Radiation lung dose and radiation pneumonitis relationship.
Incidence of G2+ RP as a function of the fraction-size adjusted mean lung dose (MLD2) in ipsilateral lung (A) and physical mean lung dose in combined lung (B). Vertical error bars indicate 68% confidence intervals. Horizontal bars, when shown, are ±1 standard deviation calculated for grouped data. Lines show probit model curves obtained by independently fitting the incidence of pneumonitis as a function of ipsilateral MLD2 (44,48) or combined MLD (18,39); see Table 4 for other model studies.

