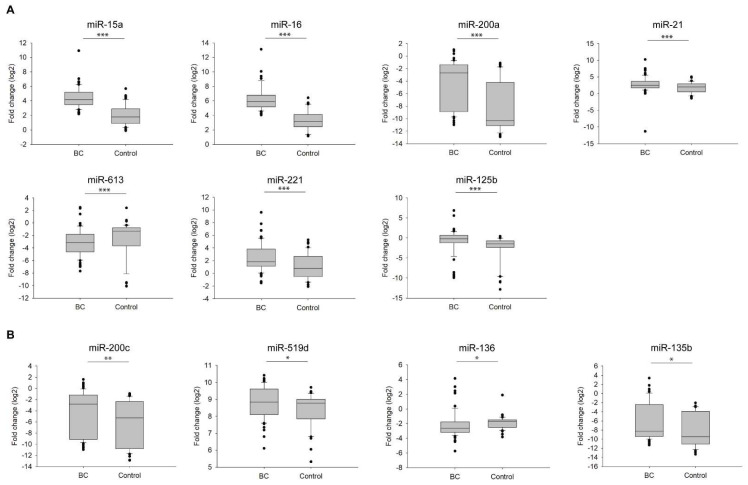
Figure 2.
Fold change (log2) of miRNAs expression with significant alterations in BC patients (BC) compared with healthy individuals (Control). (A) Expressional analyses of miRNAs (miR-15a, miR-16, miR-200a, miR-21, miR-613, miR-221, and miR-125b) with a highly significant difference *** p < 0.001; (B) Expressional analyses of miRNAs (miR-200c, miR-519d, miR-136, and miR-135b) with a lower significant difference ** p < 0.01, and * p < 0.05. Error bars represent the standard deviation of each miRNA measured on either the group of BC patients (BC) or healthy individuals (Control).

