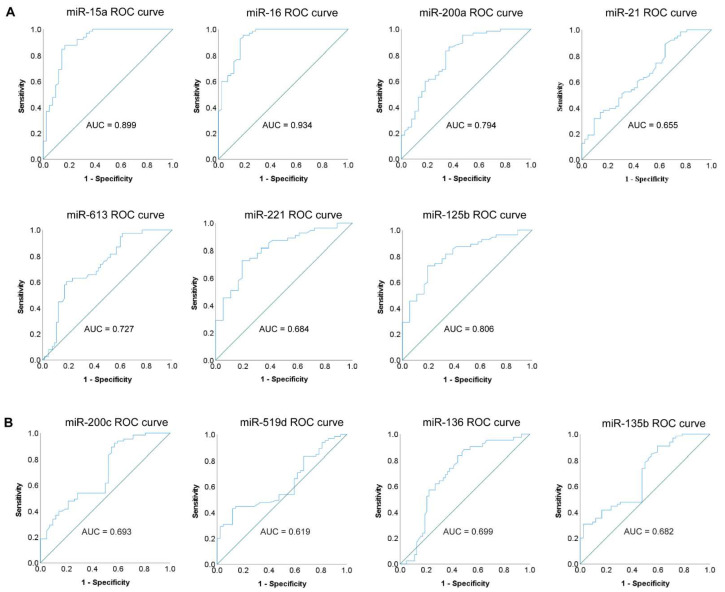
Figure 3.
ROC curve analysis of individual miRNAs for validating their diagnostic accuracy. (A) ROC curves and the related AUC (area under the receiver operating characteristic curve) values of miRNAs (miR-15a, miR-16, miR-200a, miR-21, miR-613, miR-221, and miR-125b) with a highly significant difference; (B) ROC curves and the related AUC values of miRNAs (miR-200c, miR-519d, miR-136, and miR-135b) with a lower significant difference. Blue line represents the ROC curve, and the diagonal line depicts the line of no-discrimination.

