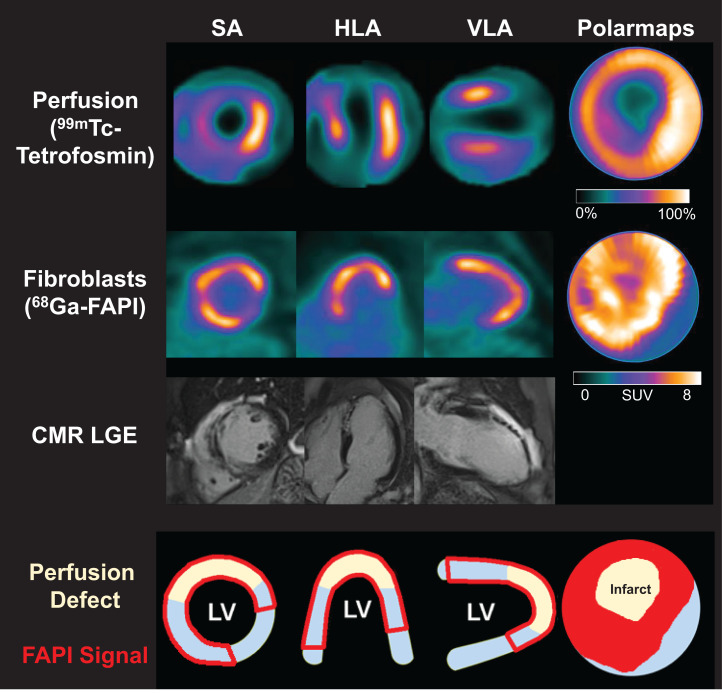
FIGURE 2.
Myocardial perfusion images using 99mTc-tetrofosmin at rest, 68Ga-FAPI PET, LGE from CMR, and schematic drawings of LV. Area of fibroblast activation as indicated by 68Ga-FAPI-46 PET signal exceeds infarct area and LGE signal, the most common type of myocardial FAP distribution. HLA = horizontal long axis; SA = short axis; VLA = vertical long axis.

