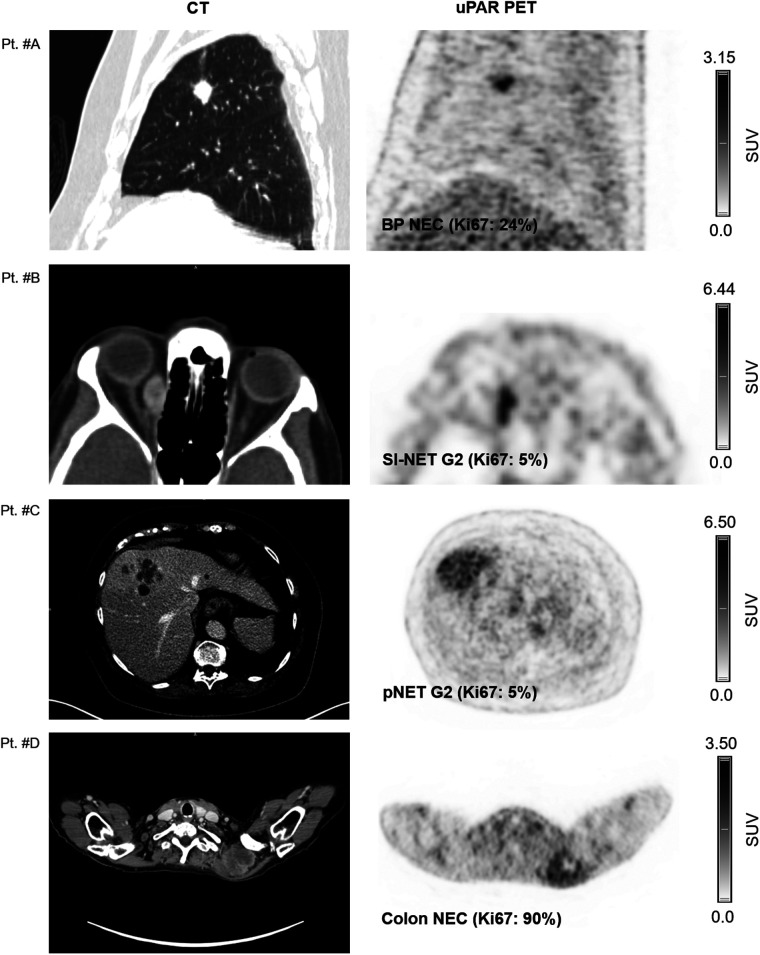
FIGURE 1.
Representative examples of uPAR PET/CT imaging. CT (left column) and uPAR PET (right column) are shown for 4 patients (patients A–D) with high- and low-grade NENS. Top of individual scale bar corresponds to SUVmax of tumor. Pt. #A: Bronchopulmonary NEC (Ki67: 24%). Pt. #B: Orbital metastasis from small intestine NET G2 (Ki-67: 5%); Pt. #C: Large liver metastasis from pancreatic NET G2 (Ki-67: 5%). Pt. #D: Large intramuscular metastasis from primary colon NEC (Ki-67: 90%). BP = bronchopulmonary; SI = small intestine; pNET = pancreatic NET.

