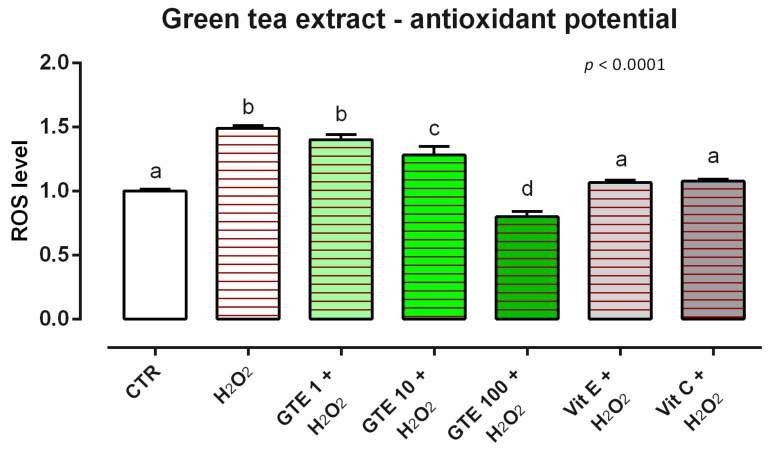
Figure 12.
Effects of green tea extract on intracellular ROS production: ROS level of Caco-2 cells treated with 1, 10, or 100 ppm of GTE and challenged with 500 μM of hydrogen peroxide (H2O2) for 60 min. ROS production was assessed by CellROX® deep red reagent assay and expressed as fluorescence intensity calculated relative to the control group. Values in the graph are means (n = 6) ± SEM. Different letters indicate statistical significance with p < 0.05. 500 μM of hydrogen peroxide (H2O2) was used as a positive control. Vitamin E (Vit E) and vitamin C (Vit C) were used as a standard of antioxidant potential.

