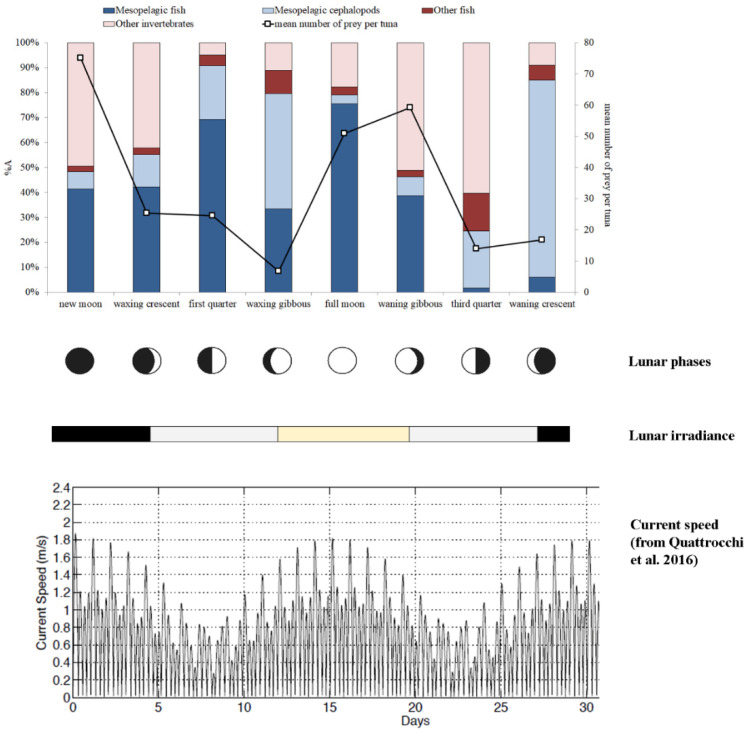
Figure 2.
Relative percentage abundance (%A) of food categories consumed by Thunnus thynnus during the different moon phases (bar plots). The mean number of preys per tuna across the lunar cycle is also present (line). The lunar irradiance and current strength are also shown for the entire lunar cycle. Lunar irradiance: black = low intensity; grey = medium intensity; yellow = high intensity. Shown as well is a time series of current strength observed during an entire lunar cycle in the Strait of Messina (graph modified from Quattrocchi et al. [64]).

