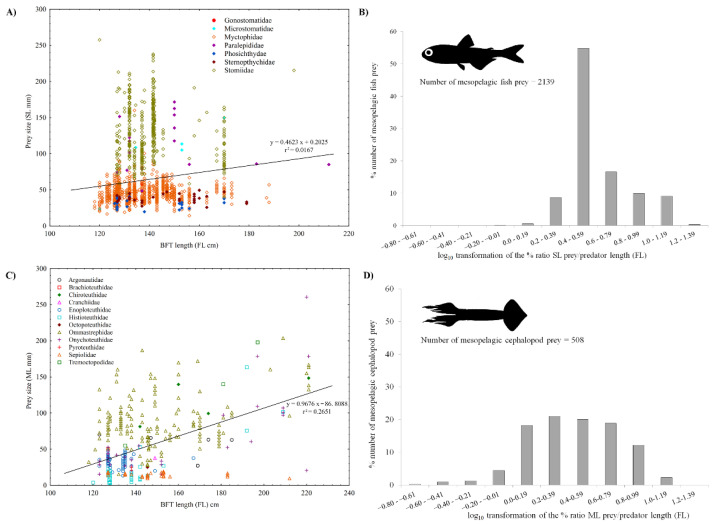
Figure 7.
Relationship between the BFT fork length (FL cm) and the size of mesopelagic fish (A) and cephalopod (C) prey. Standard length (SL mm) and mantle length (ML mm) were considered for fish and cephalopod food items, respectively. Linear regression equations are also given. The histograms in (B,D) show the log10 transformation of the percent ratio between mesopelagic prey length and tuna fork length, for fish and cephalopods, respectively.

