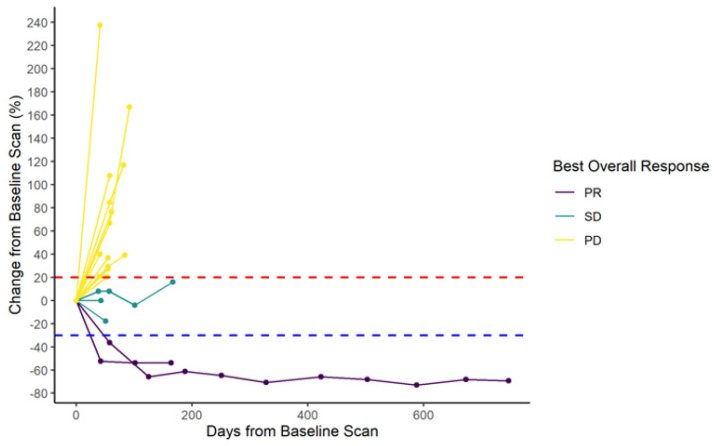
Figure 1.
Response to AI plus pembrolizumab (N = 20). Spider plot showing relative change in tumor size from baseline. Each line represents one patient in study. Two patients had partial response (PR), three had stable disease (SD), and 15 had progression of disease (PD). One patient had sustained PR until end of treatment (35 cycles) of pembrolizumab plus exemestane and maintained response on single agent exemestane until data cut-off of July 2021. Red line indicates 20% of increased tumor size per RECIST 1.1. Blue line indicates 30% of reduced tumor size per RECIST 1.1.

