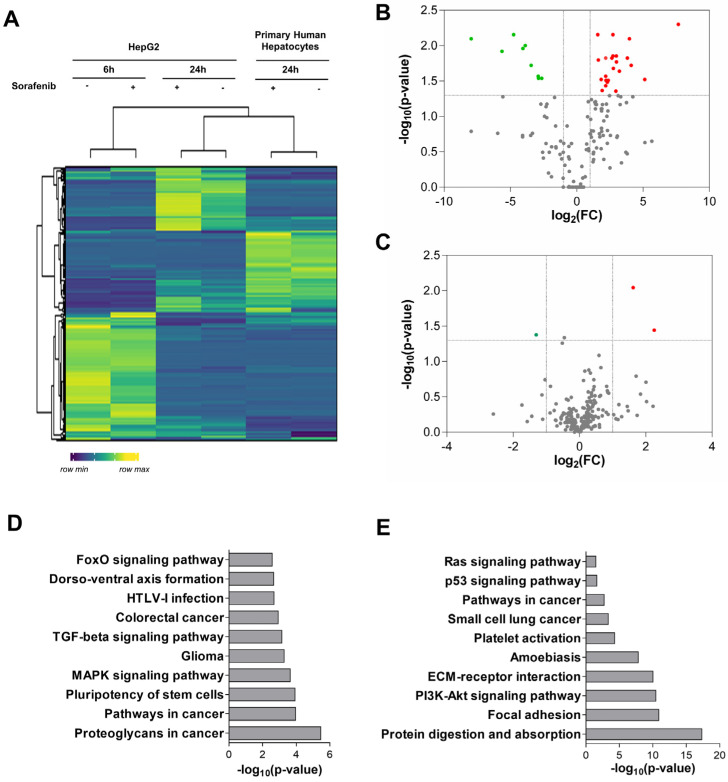
Figure 1.
miRNA pattern induced in primary human hepatocytes. (A) Heatmap of miRNA expression in HepG2 cell lysates at 6 and 24 h of treatment, compared to primary hepatocyte expression profile after Sorafenib (24 h) (n = 3). (B) Volcano plot of miRNA expression analysis in the HepG2 cells compared to primary human hepatocytes (non-treated) (n = 3). Up-regulated miRNAs are shown in red and down-regulated miRNAs are shown in green. (C) Volcano plot of differentially expressed miRNAs in primary human hepatocytes treated with Sorafenib (24 h) (n = 3). (D) Top 10 most significant KEGG pathways enriched in targets of miRNAs differentially expressed in HepG2 cells. (E) Top 10 most significant KEGG pathways enriched in targets of miRNAs differentially expressed in treated primary human hepatocytes.

