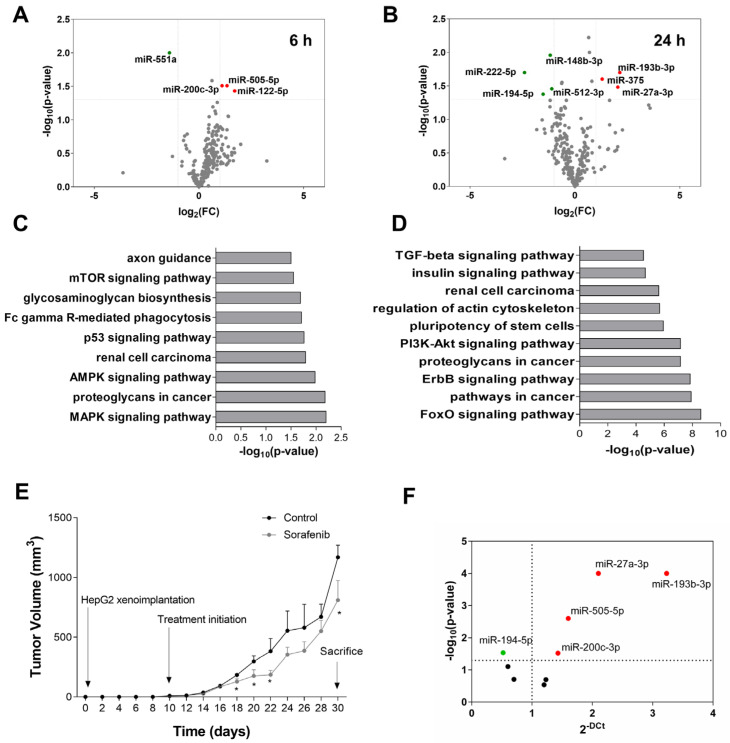
Figure 2.
miRNA expression profile induced by Sorafenib in cellular and mouse models. (A) Volcano plot of miRNA expression analysis in cell lysates at 6 h of treatment (n = 3). Up-regulated miRNAs are shown in red and down-regulated miRNAs are shown in green. (B) Volcano plot of miRNA expression analysis in cell lysates at 24 h of treatment (n = 3). Up-regulated miRNAs are shown in red and down-regulated miRNAs are shown in green. (C) Top 10 most significant KEGG pathways enriched in the targets of miRNAs differentially expressed at 6 h of treatment. (D) Top 10 most significant KEGG pathways enriched in the targets of miRNAs differentially expressed at 24 h of treatment. (E) Tumor volume monitoring during Sorafenib and vehicle treatments. (F) Differentially expressed miRNAs in the tumors of subcutaneous mouse models treated with Sorafenib (n = 14).

