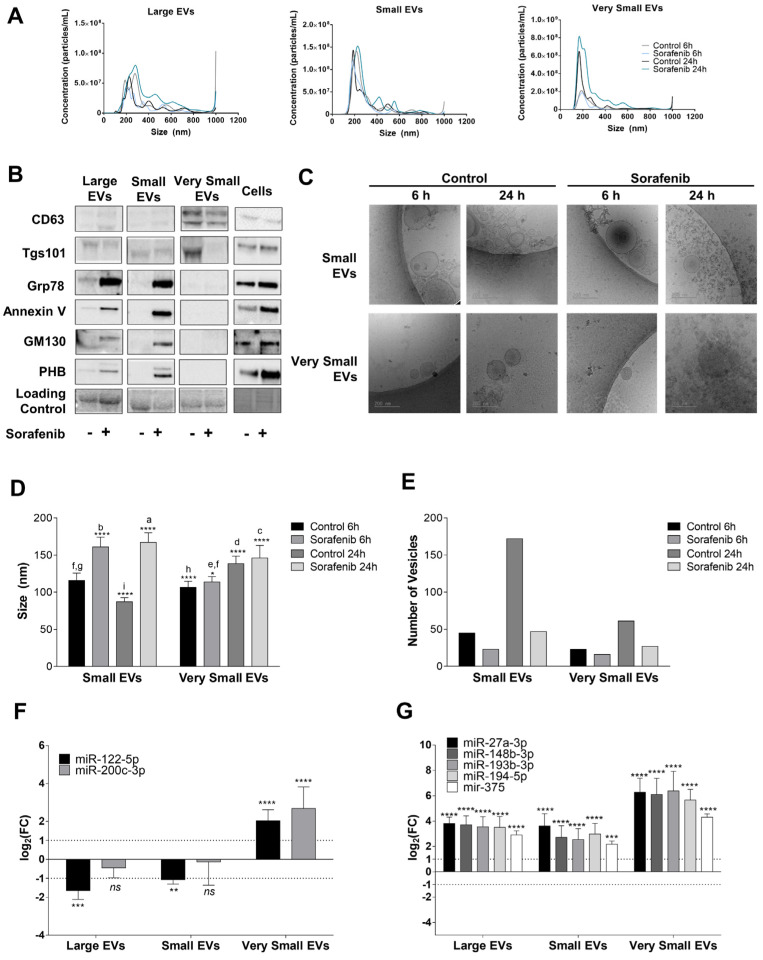
Figure 4.
Extracellular vesicle secretion induced by Sorafenib and their miRNA content. (A) Particle size and concentration analysis of Large, Small, and Very Small EVs obtained at 6 and 24 h. (B) Expression of EV markers and cellular contaminants in Large, Small, and Very Small EVs and cell lysates obtained at 24 h after Sorafenib treatment. Total lane protein content was used as the loading control. (C) Representative images of cryo-EM of Small and Very Small EVs obtained at 6 and 24 h from the control and Sorafenib-treated cells. (D) Assessment of EV size (nm) in the cryo-EM images. (E) Number of EVs quantified in the cryo-EM images. (F) miRNA expression in the three fractions of EVs at 6 h. (G) miRNA expression in the three fractions of EVs at 24 h. Fold-change values were calculated between Sorafenib and the control treated samples. Results are expressed as the mean ± SEM of six independent experiments. Ns, non-significant; * p ≤0.05, ** p ≤ 0.01, *** p ≤ 0.001, and **** p ≤ 0.0001 between the miRNA expression in the control and Sorafenib derived EVs. Multiple comparison test statistics are expressed with lower case a–i.

