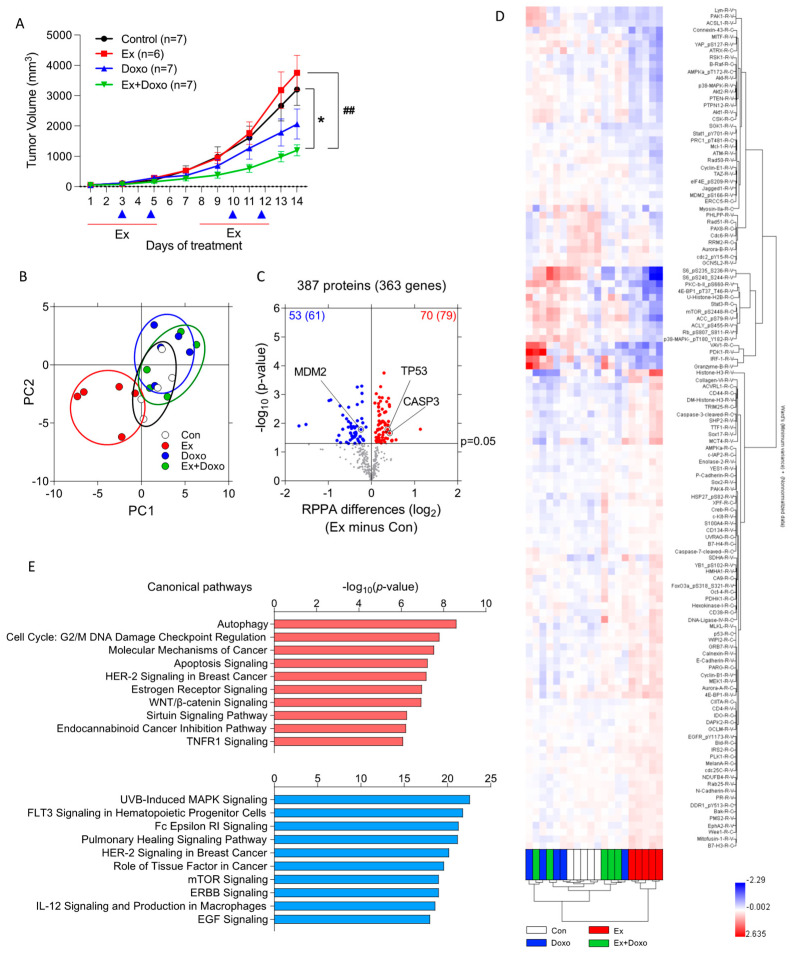
Figure 1.
Exercise changes numerous signaling pathways in B16F10 tumors. (A) B16F10 tumor volume was measured by caliper over time in mice treated with exercise (Ex), doxorubicin (Doxo), Ex plus Doxo (Ex + Doxo), or no exercise (Con) (n = 6 or 7 tumors per group). Red line and blue triangle indicate the day(s) that mice were treatment with exercise and(or) doxorubicin, respectively. Data are shown as mean ± SEM. * p < 0.05 vs. Con, ## p < 0.01 vs. Ex. (B–D) RPPA was performed on B16F10 whole-tumor homogenates from Ex, Doxo, Ex + Doxo, or Con mice (n = 5 tumors per group). (B) Principal component analysis (PCA) summarized different protein signatures from 387 proteins among groups. (C) A volcano plot analysis identified significantly increased (red, n = 70) and decreased (blue, n = 53) proteins in B16F10 tumors from Ex mice compared to tumors from Con mice. The number following the protein numbers indicates the predicted number of changed genes based on RPPA data. The horizontal line indicates p-value at 0.05. (D) Hierarchical clustering was performed using the 123 significantly changed proteins or protein modifications from the comparison between Ex and Con. (E) An Ingenuity Pathway Analysis determined the top 10 upregulated (red) and downregulated (blue) canonical pathways in tumors from Ex relative to Con mice.

