Figure 3.
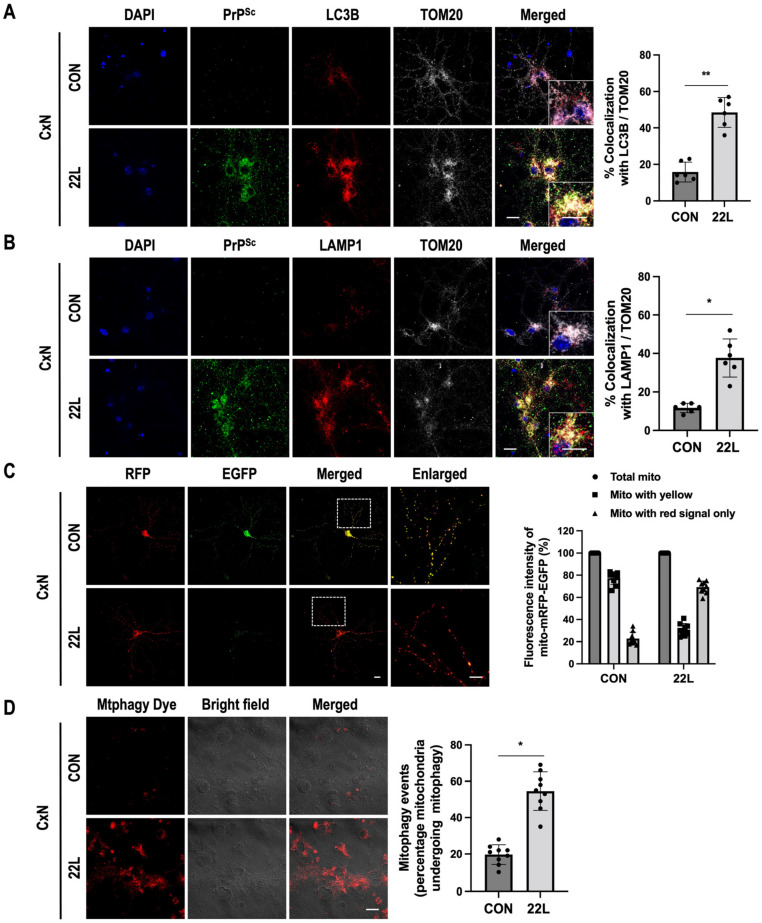
Scrapie infection induces autophagy in mitochondria containing PrPSc. (A,B) The colocalization of TOM20 (white) with LC3B (red) and LAMP1 (red) in control (CON) or 22L scrapie-infected (22L) CxN cells at 21 dpi was determined using confocal microscopy. Quantification of mitophagosome (A) and mitophagolysosome (B) formation was analyzed with EzColocalization plugin for ImageJ software version 1.53a (n = 6, ** p < 0.01, * p < 0.05; two-sided Student’s t-test). Enlarged insets (white line boxes) showed the sections at a higher magnification. For PrPSc staining, CxN cells were treated with 98% formic acid for 7 min and then immunostained with an anti-PrP (C-20) antibody (green). (C) Transient expression of p-mito-RFP-EGFP by primary cortical neuronal cells targeting mitochondria was determined using confocal microscopy, and mitophagic flux was analyzed with ImageJ software version1.53a (yellow signal, no mitophagy; red signal, mitophagy). DAPI (blue) was used to counterstain the nuclei; enlarged insets (dashed white line boxes) showed the sections at a higher magnification, scale bar, 20 μm. (D) Detection of mitophagy with Mtphagy Dye staining (red) using confocal microscopy in control (CON) or 22L scrapie infected (22L) CxN cells at 21 dpi. The intensities of the Mtphagy dye fluorescence were analyzed using ImageJ software and quantified for each group (n = 9, * p < 0.05; two-sided Student’s t-test), n = number of independent experiments, scale bar, 20 μm.

