Figure 3.
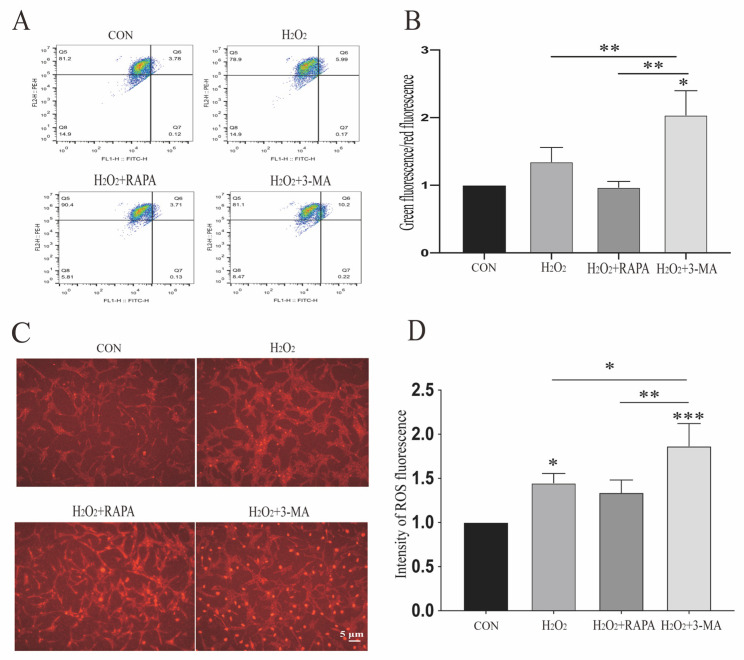
Regulation of autophagy can impact mitochondrial membrane potential and ROS generation of MGCs under oxidative stress. (A) In conditions of oxidative stress, the mitochondrial membrane potential significantly decreased after treatment with 3-MA (1 mM). (B) Quantitative analysis of mitochondrial membrane potential in different groups was performed. Data are shown as means ± SEMs (n = 3 per group; * p < 0.05 and ** p < 0.01). (C) ROS generation in r-MCs with upregulation and downregulation of autophagy under hypoxia was detected by immunofluorescence using a DHE kit. Scale bar: 5 μm. (D) Quantitative analysis of ROS fluorescent intensity in different groups was performed. Data are shown as means ± SEMs (n = 3 per group; * p < 0.05, ** p < 0.01 and *** p < 0.001). RAPA, rapamycin; 3-MA, 3-methyladenine; OPA1, optic atrophy gene 1; DRP1, dynamin-related protein 1.

