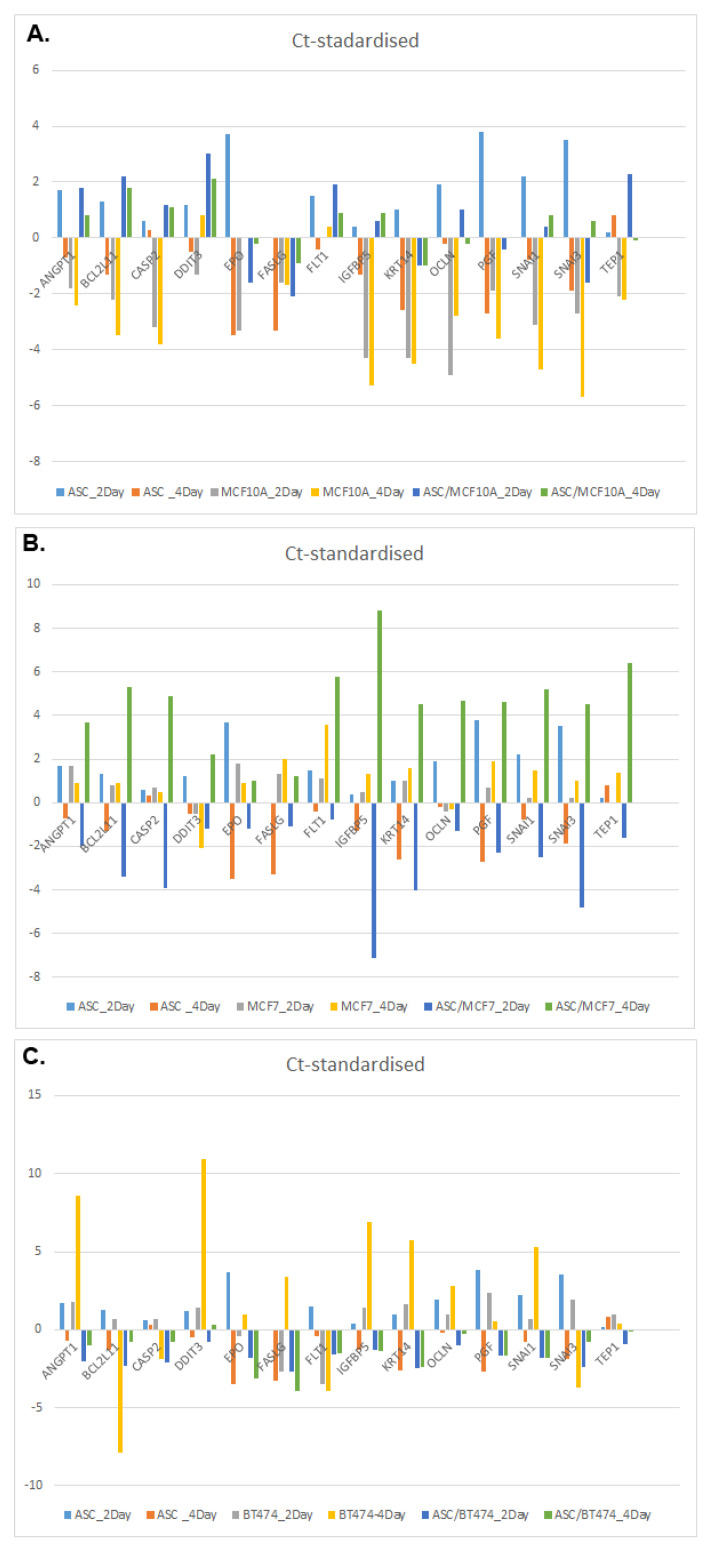
Figure 5.
Expression patterns of the 14 genes with the strongest variations. For an overview of the gene abbreviations, please refer to Table 1. A positive value indicates a higher Ct value and thus down-regulated gene expression. A negative value means earlier and thus increased gene expression. (A) Expression patterns of ASC, MCF-10A cells and co-cultures. (B) Expression patterns of ASC, MCF-7 cells and co-cultures. (C) Expression patterns of ASC, BT-474 cells and co-cultures.

